preview
We're still working on this feature, but we'd love for you to try it out!
This feature is currently provided as part of a preview program pursuant to our pre-release policies.
This page covers the updated version of Pathpoint. For the generally available version, see Introduction to New Relic Pathpoint.
The KPIs page gives you a dedicated view to analyze the business metrics configured for your flow. To access it, select KPIs from the navigation within a flow.
The KPIs page displays all KPIs configured for your flow as time series charts, giving you a deeper view into how your key business metrics are trending over time.
Each KPI chart shows a time series visualization of how the metric has trended over time. Use the time picker in the top right to adjust the time range of the chart, such as the last 30 minutes or the last hour.
KPIs are grouped by scope:
- Global KPIs: Apply to the whole flow.
- Stage-level KPIs: Apply to a specific stage.
To manage your KPIs, click Manage KPIs in the top right.
Manage KPIs
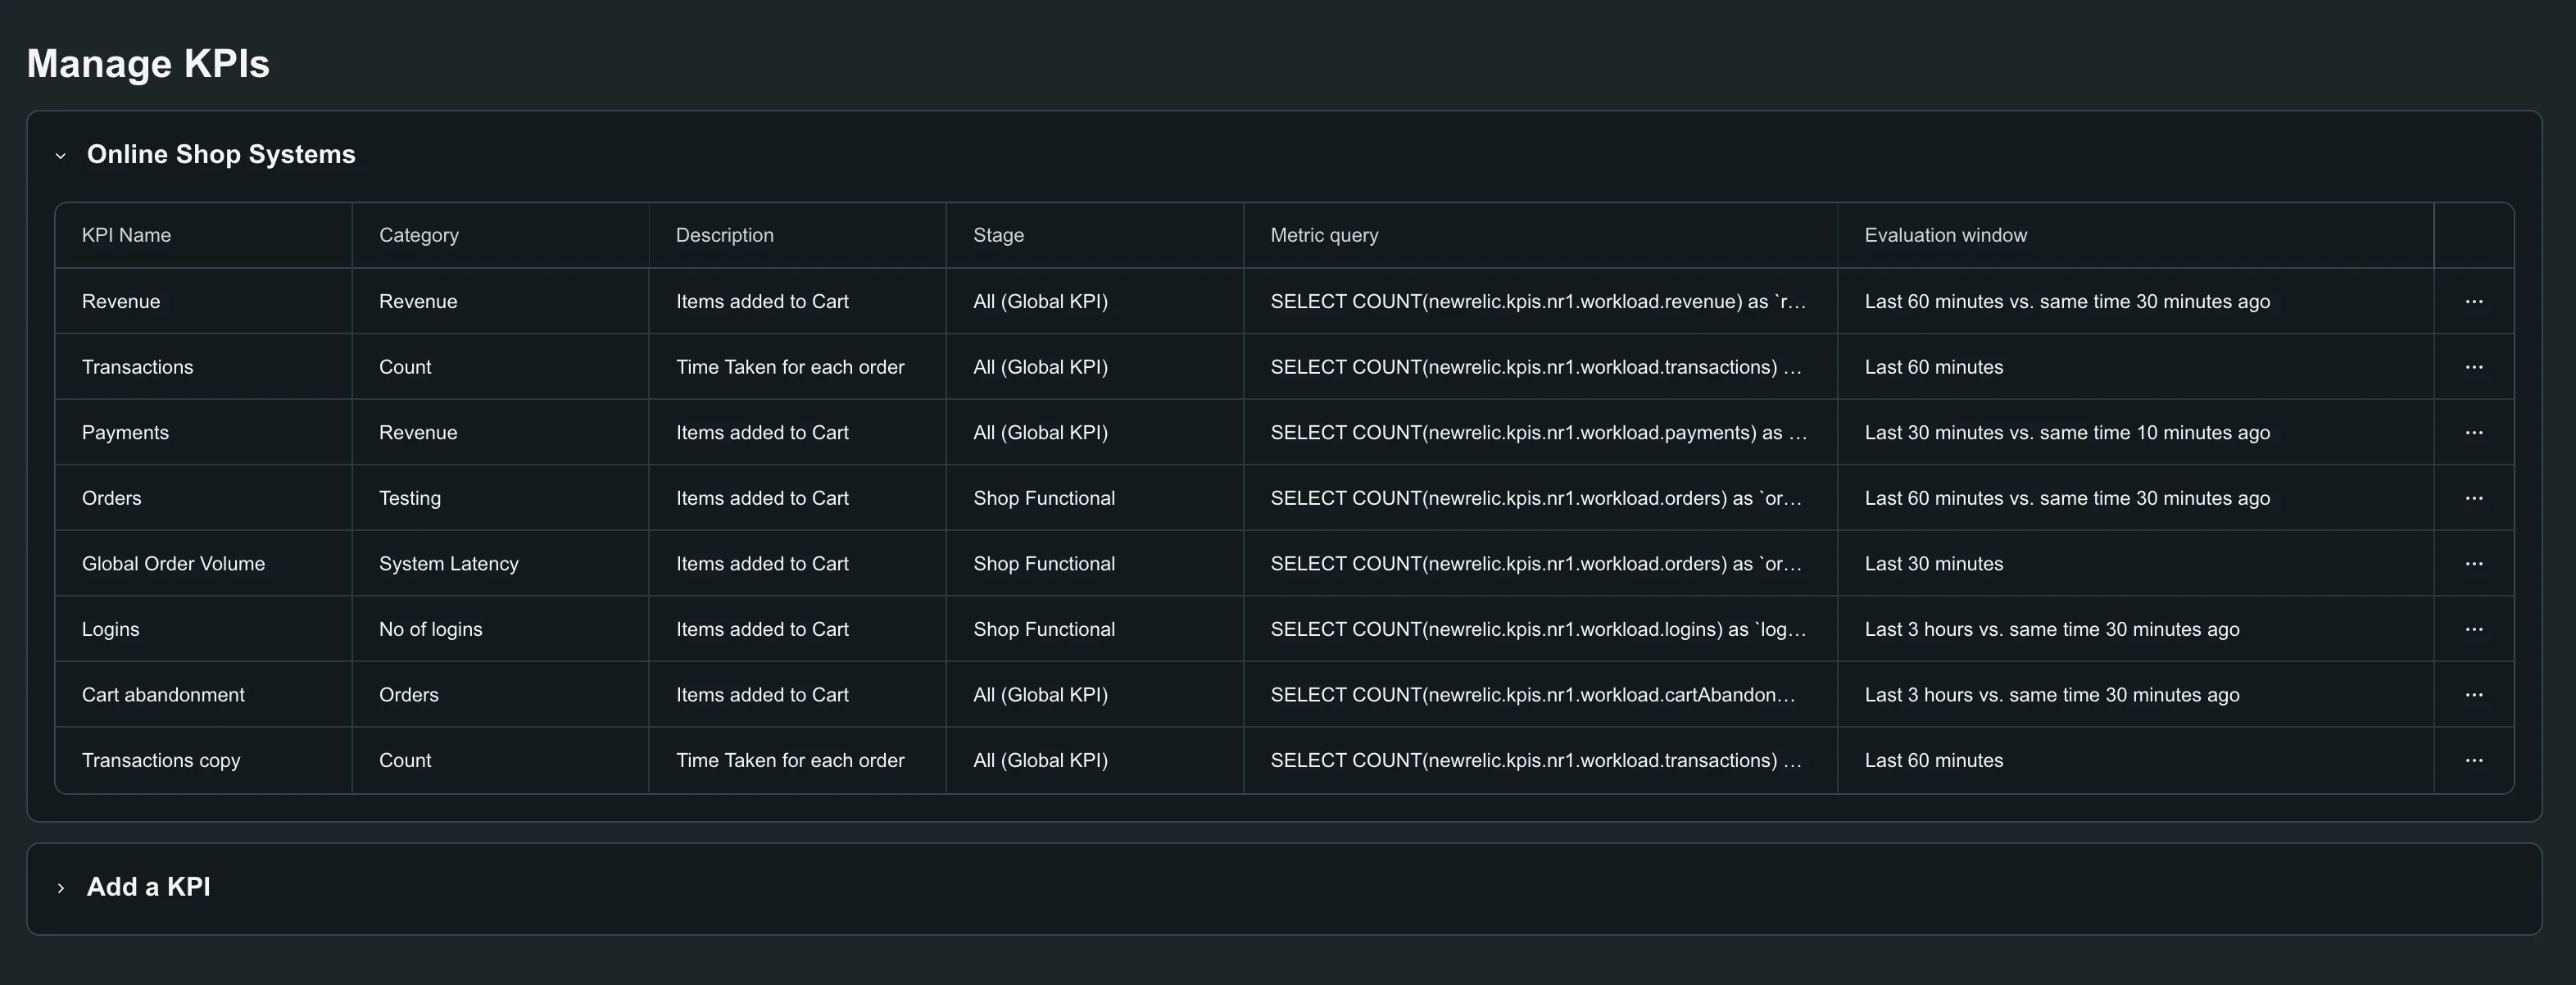
The Manage KPIs page is where you create, edit, and delete the KPIs for your flow. It shows a table of all configured KPIs with their name, category, description, stage, Metric query, and Evaluation window.
Add a KPI
On a flow's Summary tab, click + Add KPIs.
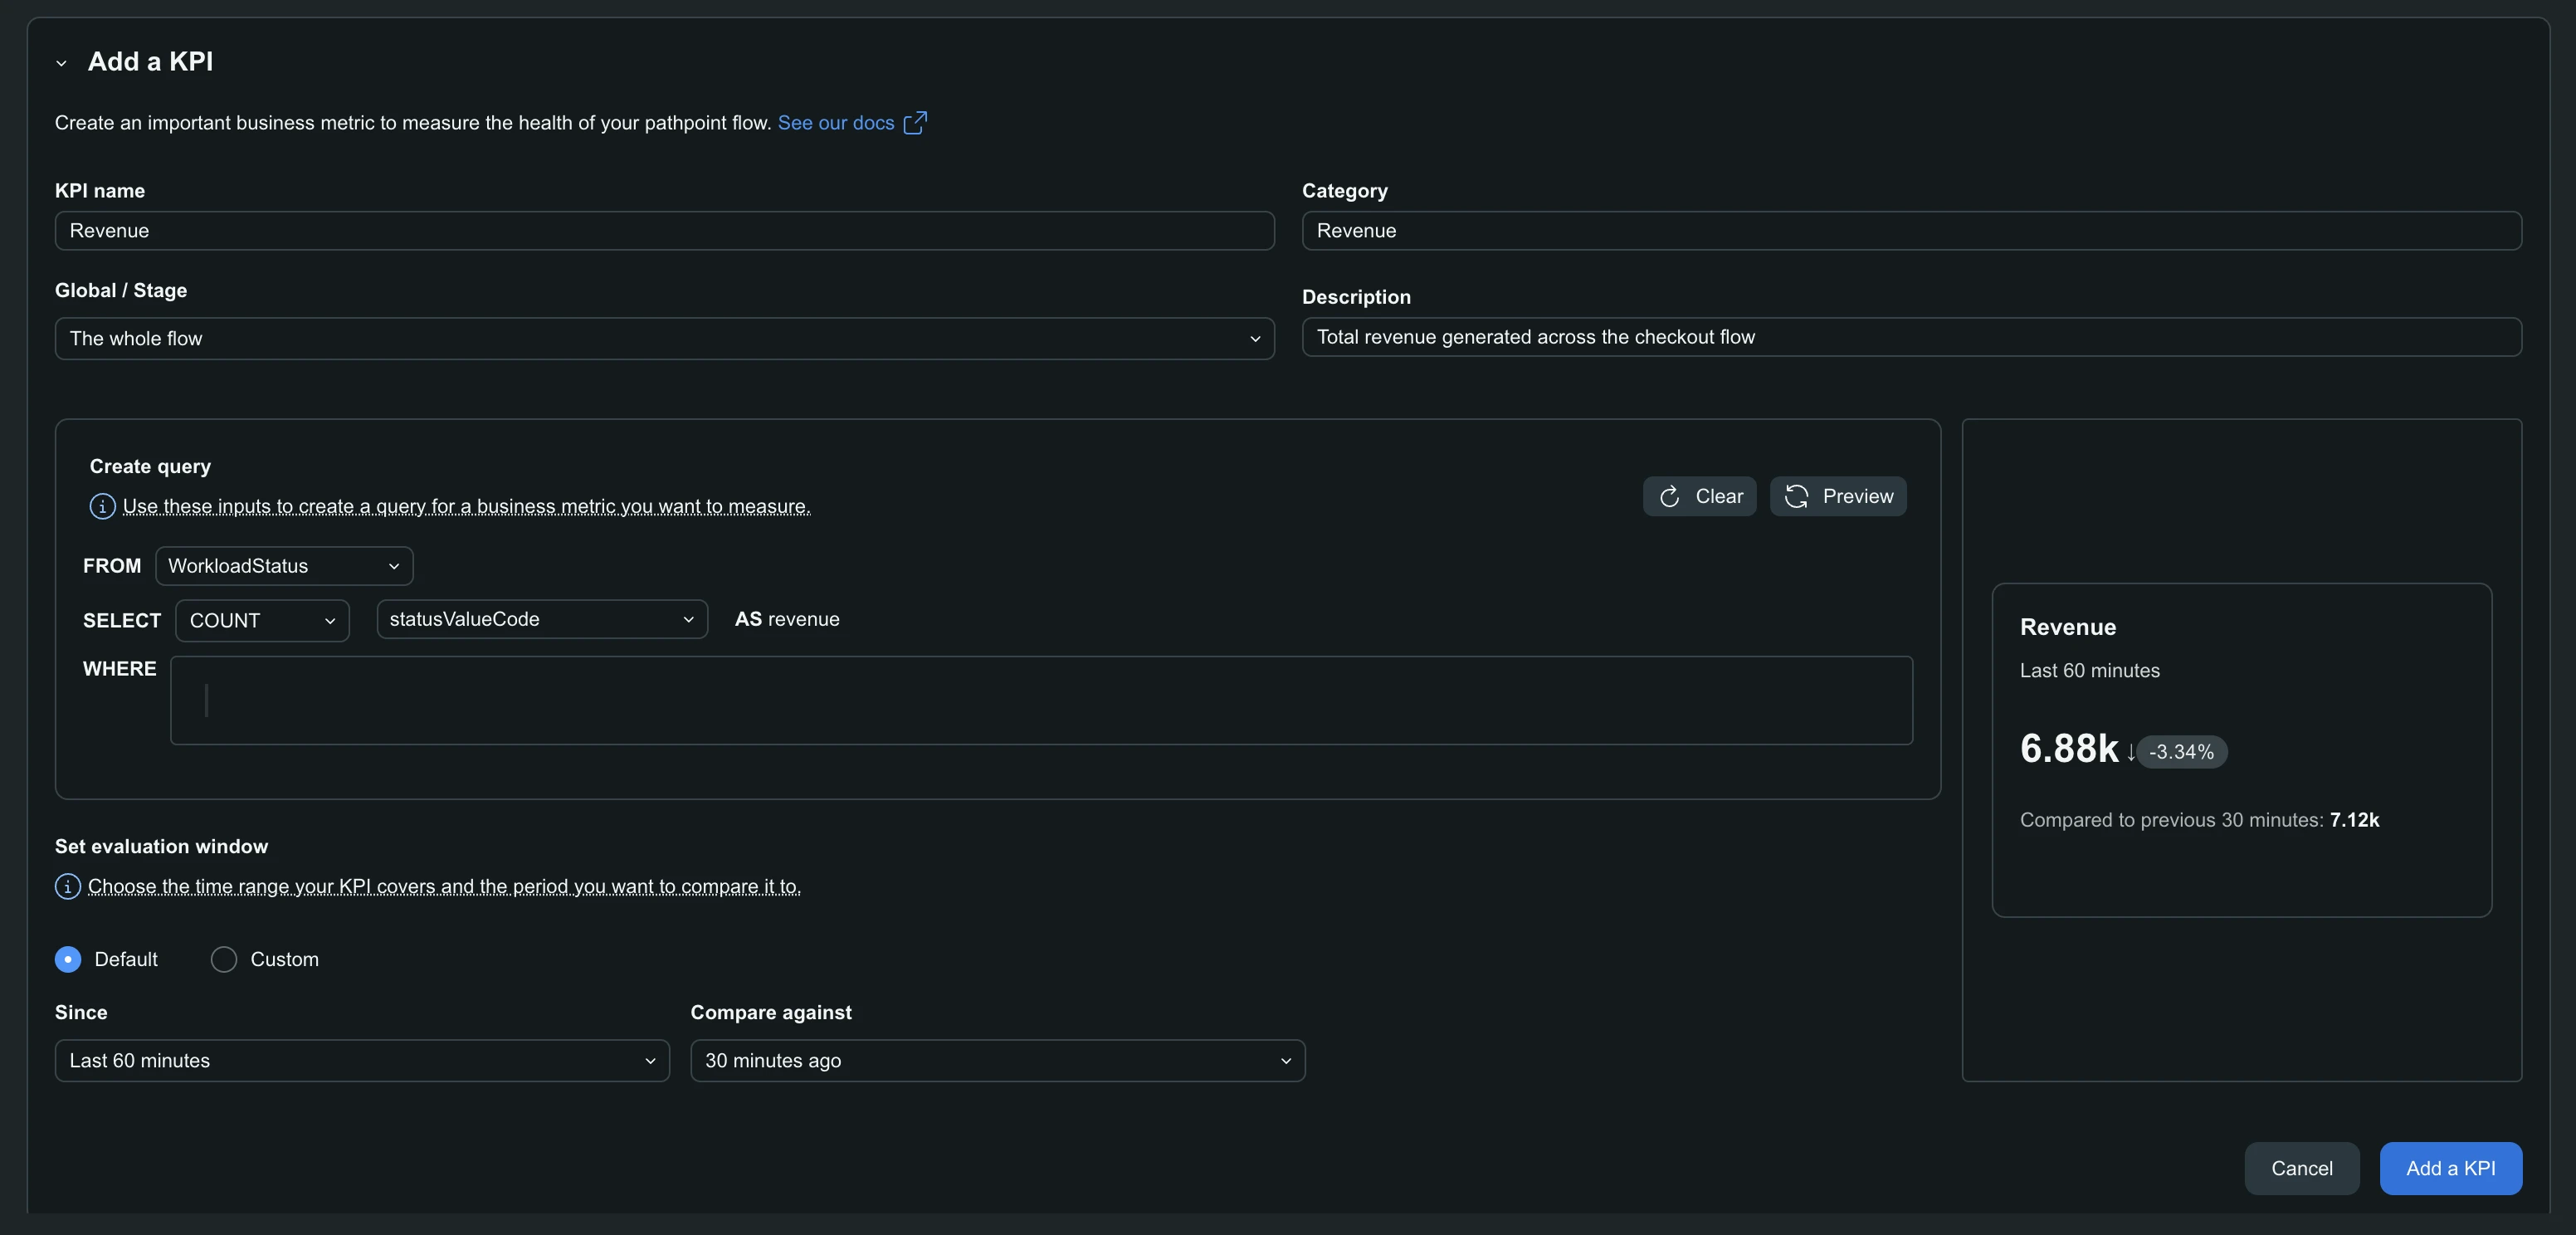
- Enter a KPI name, and optionally a Category and Description.
- In Global / Stage, choose the whole flow or a specific stage.
- Under Create query, build the query that converts raw events into a business metric:
- FROM: The event type.
- SELECT: The aggregation and attribute, named with AS.
- WHERE: Optional conditions.
- Under Set evaluation window, keep Default, or select Custom and set Since and Compare against.
- Click Preview to check the results.
- Click Add a KPI.
Note
Since and Compare against accept relative time only, so the KPI stays current. Absolute timestamps aren't supported.
The Flow view has no time picker. It shows current state, so Set evaluation window is what sets a KPI's cadence, such as week over week or month over month.
Edit, duplicate or delete a KPI
Click the ... menu on a KPI's row in the table:
- Edit: Reopens the KPI so you can change any of its fields.
- Duplicate: Creates a copy to modify, useful for a variant of an existing KPI.
- Delete: Removes the KPI from the flow.
Caution
Deleting a KPI is permanent and cannot be undone.