preview
We're still working on this feature, but we'd love for you to try it out!
This feature is currently provided as part of a preview program pursuant to our pre-release policies.
Earlier version available
For the current generally available version of Pathpoint, see Introduction to New Relic Pathpoint.
When something breaks in a complex system, the hardest part isn't fixing it. It's figuring out what it means for the business and where to look first.
Pathpoint maps your technical health to the business journeys your customers actually take, such as checkout, onboarding, and in-store payments. Instead of staring at a list of service alerts, you see exactly which stage of the customer journey is degraded and what business metric is moving because of it.
When payment latency spikes, Pathpoint tells you: the Checkout stage is unhealthy, cart abandonment is climbing, and here's which microservice in the dependency chain is failing and which team owns it. The SRE knows exactly where to go. Incident communicators and business stakeholders know what's impacted and why it matters, without waiting on a bridge call to find out.
Pathpoint is available in the All Capabilities section of the New Relic platform. Select Pathpoint to open the Flows page.
Flows page
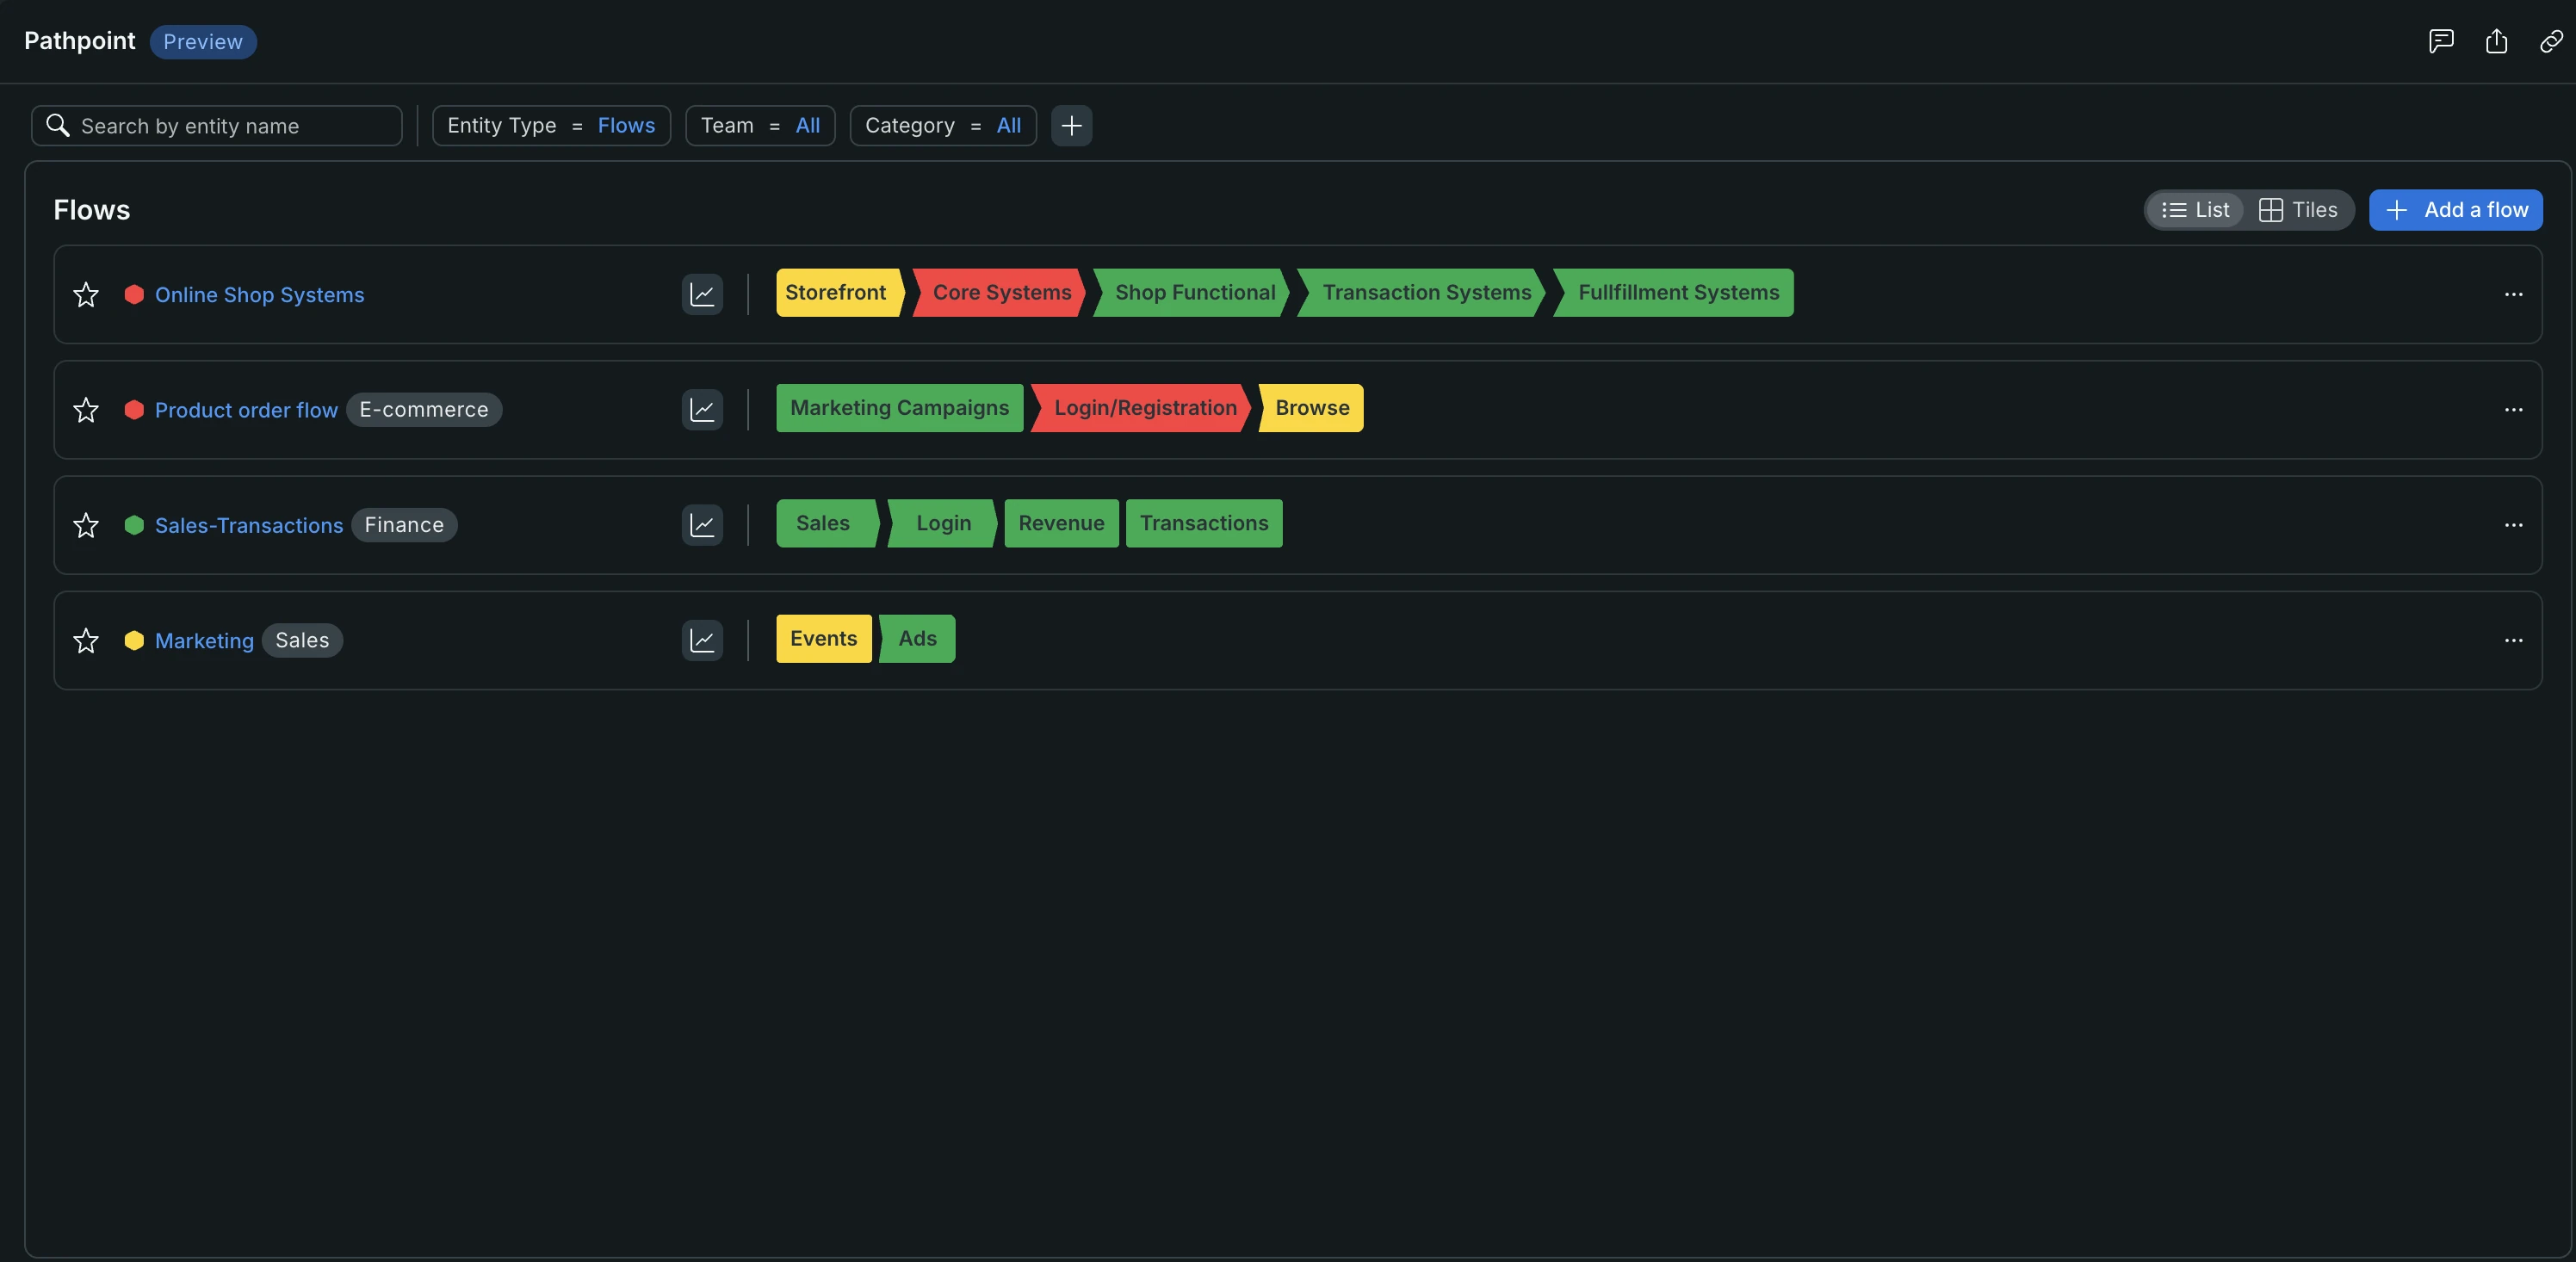
The Flows page is your home base for all the flows configured in your account. Each row represents a critical business journey you set up to monitor.
If no flows have been created yet, you'll be prompted to create your first one. See Create and manage flows for more details.
Note
Pathpoint shows flows for your currently selected account. To see flows from a different account, use the account dropdown at the top of the screen.
Each row in the list represents one flow. At a glance, you can see:
- Health status: The entity icon next to the flow name indicates its current health: green (healthy), yellow (warning), red (critical), or grey (unknown).
- Name and tag: The name of the flow, with an optional category tag (for example, E-Commerce or Fintech) to help organize your flows.
- Stages & their health: The set of stages that make up the journey, shown as pills. Each pill reflects the current health of that stage. For example, a purchase journey might show: Browse → Add to Cart → Checkout → Payment → Confirmation → Fulfillment.
- KPI indicator: Hover over the KPI icon to see the KPIs for that flow.
Click any row to open the Flow view, where you can see the health status of each stage in detail. See Flow view for more.
Use the Team and Category filters at the top of the list to narrow the flows shown. Use the search bar to find a flow by name.
To share a flow, click the ... menu on any row of the Flows page and select Share. This copies a permalink to the flow to your clipboard. Only users with access to the account will be able to view it.