Cloud Cost Intelligenceは、AWSやEC2の総コストなど、cloudの支出を概要として表示します。そのビューでは、いくら支出したかはわかりますが、サービスから1単位の価値を提供するのにかかるコストはわかりません。
ユニットエコノミクスは、そのギャップを埋めます。これは、クエリあたりのコスト: 1つのクエリを実行するのにビジネスにどれくらいのコストがかかるかといったビジネスメトリクスを測定します。コストが上昇した場合、ユニットメトリクスは2つのまったく異なる状況の違いを区別するのに役立ちます:
- 成長: より多くのユーザーにサービスを提供したか、より多くのクエリを実行したため、コストが上昇しました。これは通常、ビジネスの成長を反映しています。
- 無駄:作業量は変わらないのにコストが上昇しており、調査すべき非効率性があることを示しています。
ユニットメトリクスを作成
効率を追跡するには、cloudの支出をクエリやトランザクションなどのビジネスイベントに結び付けるユニットメトリクスを作成します。
- one.newrelic.com > All capabilities > Cloud Cost Intelligenceに移動します。
- Create unit costをクリックして、cloudの支出をクエリなどのビジネス価値の単位に結び付けるユニットメトリクスを設定します。
- Define New Unit Costセクションで、次のフィールドに入力します。
フィールド | 説明 |
|---|---|
Metric name (必要) | 測定したいビジネスメトリクスの名前。たとえば、チェックアウトあたりのコストです。 |
Unit (必要) | 測定の基準となる単位(例:$/トランザクション)。 |
Description | このユニットコストが何を表しているかの説明です。 |
Category | メトリクスが属するカテゴリ(例:Commerce、インフラストラクチャ、Kubernetes)。必要に応じて新しいカテゴリを追加できます。 |
Benchmark / Efficiency Score | ユニットコストのターゲット閾値です(例:2.5)。実際のユニットコストがこのベンチマーク内に収まっていれば、効率スコアは良好です。 |
コストと使用量の定義
Cloud Cost Intelligenceは、ある値を別の値で割ることでユニットコストを計算します。これら2つの部分を並べて定義します:
- Cost Definition: 支出など、測定したいコストメトリクス。
- Usage Definition:クエリ数など、測定したいビジネスメトリクス。
ヒント
2つのパネルの間にある切り替えボタンを使用して、分子と分母を入れ替えます。切り替えると、パネルのヘッダーが更新され、どちらの部分がValue Unit (Numerator)で、どちらがCost (Denominator)であるかが表示されます。これにより、ユニットあたりのコスト(例:クエリあたりのコスト)またはコストあたりのユニット数(例:特定のコストに対して提供されたクエリ数)のいずれかを測定できます。
コストの定義
FiltersタブまたはNRQLタブを使用して、コストメトリクスを定義します。
Filters
Configure Filtersをクリックして、フィルターソースを選択します:
- Cost overview:アカウント、サービス、リージョンなどのcloudプロバイダーのディメンションでフィルタリングします。
- Kubernetes: クラスタ、コンテナ、デプロイメントなどのKubernetesディメンションでフィルタリングします。
Validate & Calculate Spendをクリックして、選択した日付範囲の一致する支出を計算します。
Matched Spendの値は、フィルタの月間支出を示します。Preview Spendをクリックして結果を確認します。
NRQL
フィルターの代わりにNRQLクエリを使用してコストメトリクスを定義するには、NRQLタブを使用します。
使用状況の定義
GuidedモードまたはNRQLタブを使用して、ビジネスメトリクスを定義します。アカウントドロップダウンを使用して、クエリを行うアカウントを選択します。
Guided
次のフィールドを使用して、クエリを段階的に構築します:
フィールド
説明
Event type
クエリを行うイベント。
Aggregation
結果に適用する集計。たとえば、Countです。
Where condition (オプション)
結果をフィルタリングする条件です。WHEREキーワードなしで条件を入力します(例:appName='MyApp' AND duration>1)。
Facet (オプション)
結果をグループ化するための属性です(例:appName)。
Enable Timeseries
結果を時系列として返すかどうか。
Generated NRQL
選択内容から生成されたNRQLクエリ。
Validate & Run Queryをクリックしてクエリを実行します。
Estimated Volumeの値は、月あたりの単位数を示します。Preview Resultsをクリックして結果を確認します。
NRQL
ガイド付きモードを使用する代わりに、独自のNRQLクエリを記述するには、NRQLタブを使用します。
分子と分母
Dynamic Unit Cost Calculationパネルには、メトリクスを構築する際のライブ結果が表示されます。分子を分母で割って、Resulting Metricを算出します。たとえば、総コストをクエリの総数で割ると、クエリあたりのコストが算出されます。
結果が正しいと思われる場合は、Confirmをクリックしてユニットコストを保存するか、Discard changesをクリックして破棄します。
結果を見る
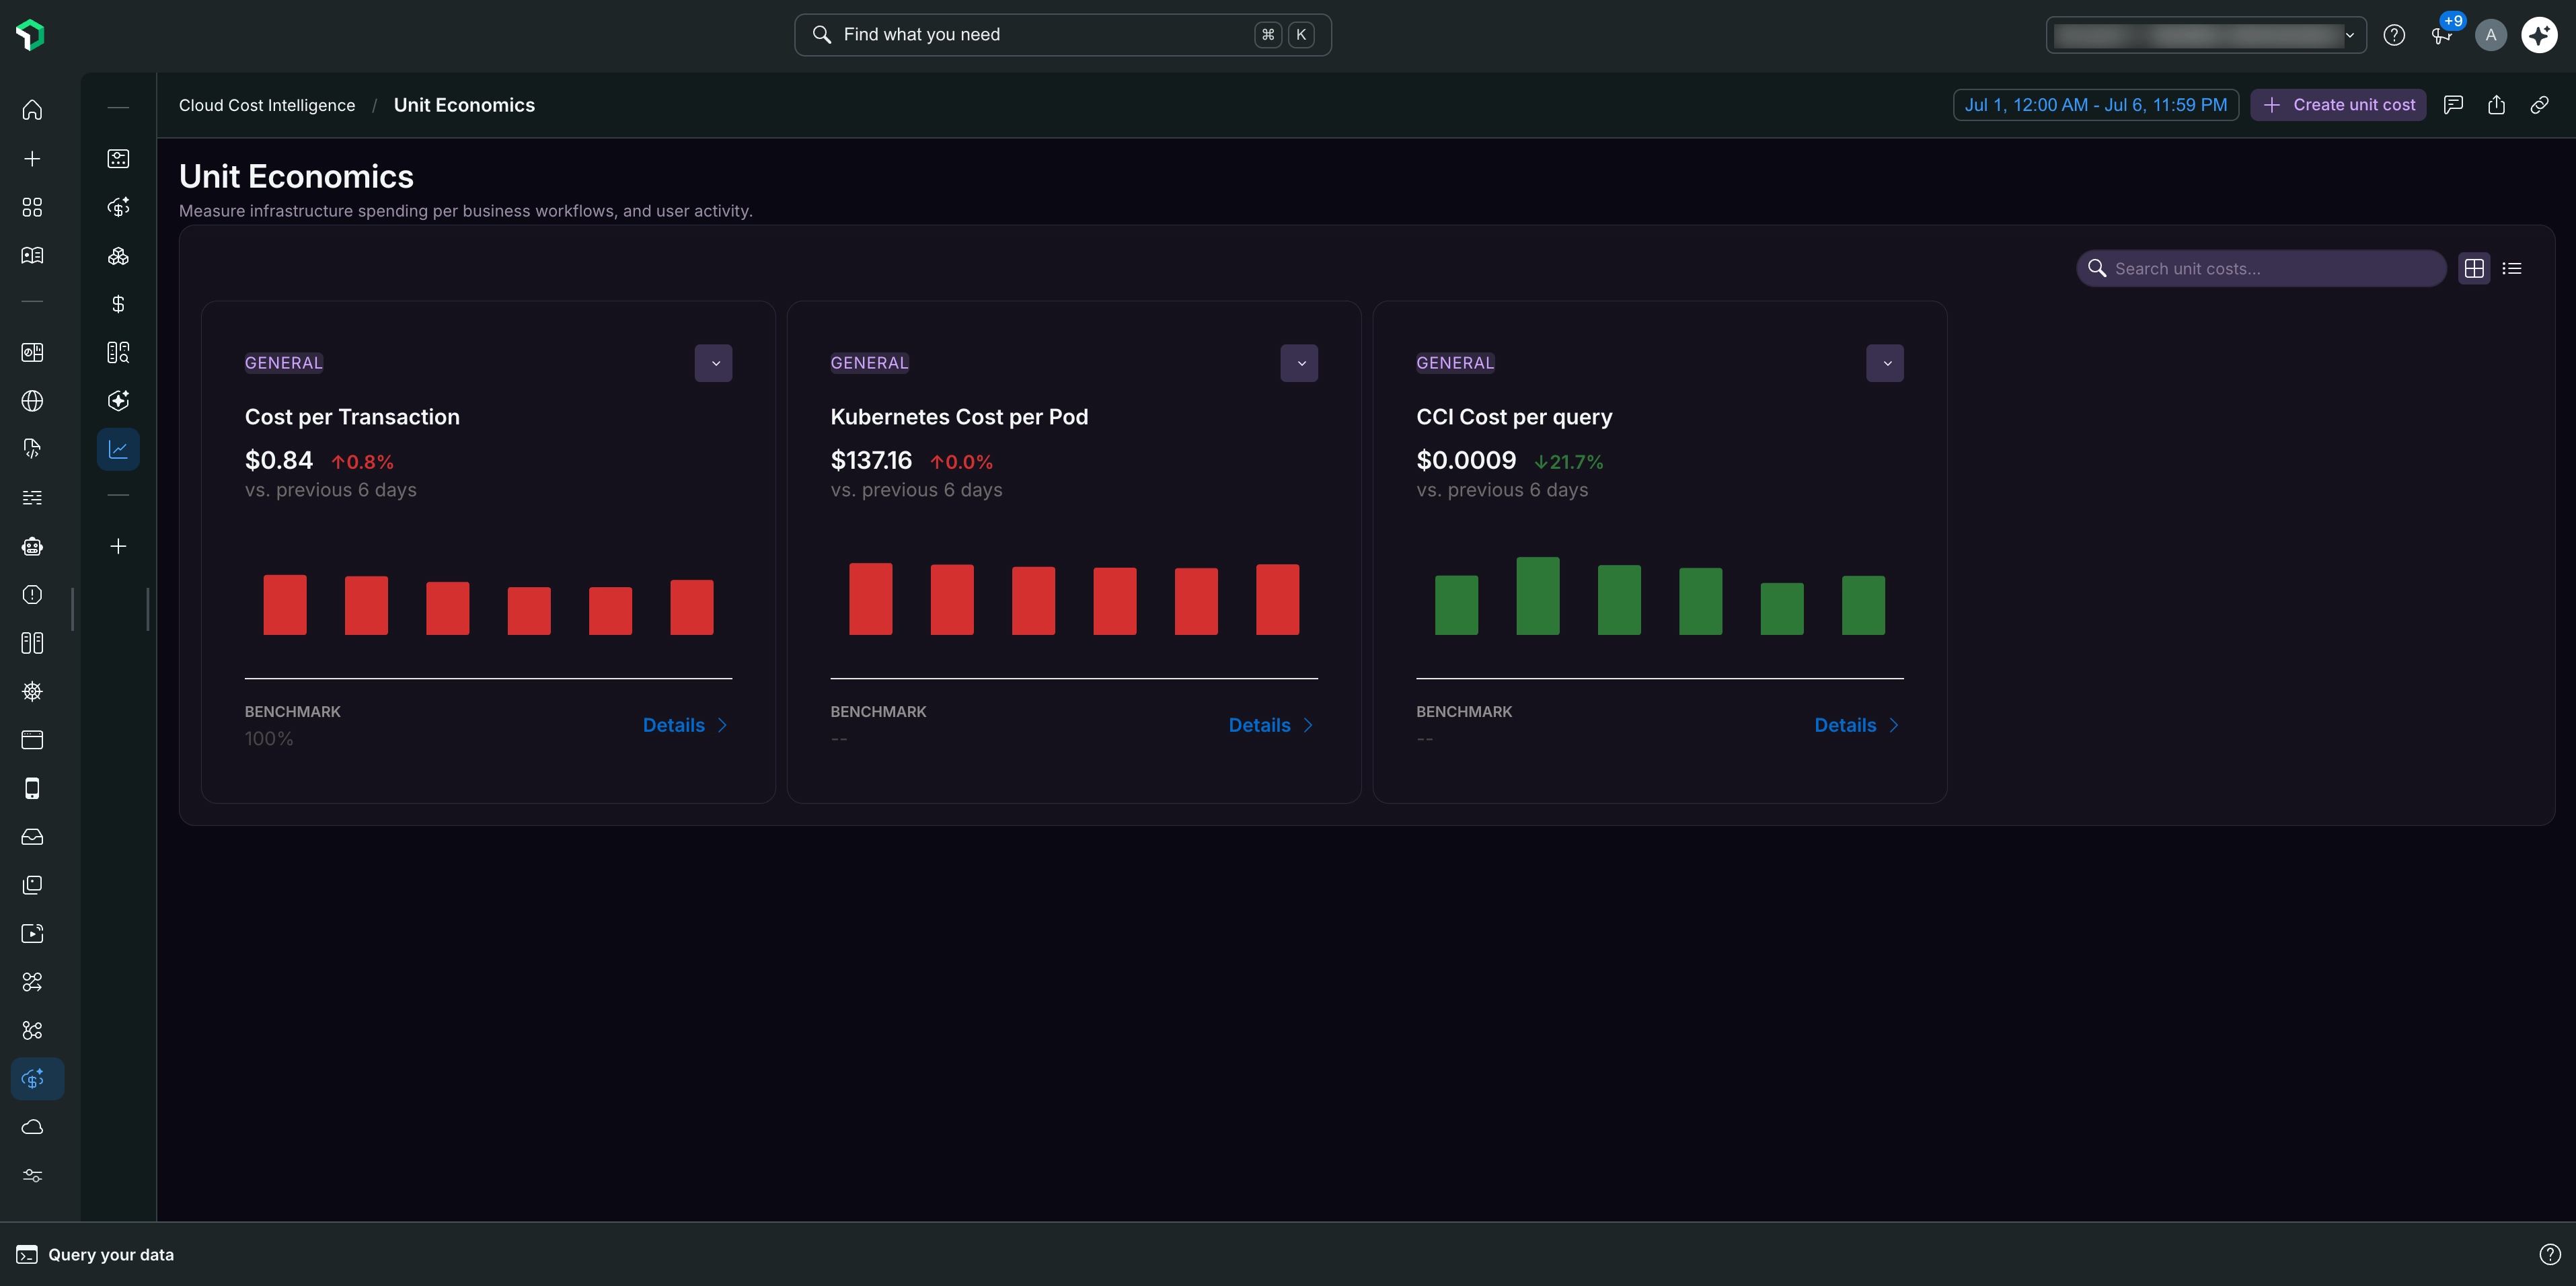
ユニットコストを作成すると、グリッドビューに、作成したすべてのユニットメトリクス(たとえば、Cost per Transaction、Kubernetes Cost per Pod、CCI Cost per query)が表示されます。
ユニットメトリクスでDetails >をクリックして、以下を含む詳細ビューを開きます:
- サマリーメトリクス:Unit Cost、Total Spend(分子)、分母のボリューム(例:Transaction Volume)、およびEfficiency Score。各メトリクスは、前の期間と比較した変化率を示します。効率スコアは、ベンチマークデータが利用可能な場合にのみ値を示します。
- Unit Cost Trend: 選択した時間範囲における総支出と単位コストをプロットするチャート。
- Cost Contribution to Unit Cost:1日あたりの総コストの割合を示すチャート。Group byドロップダウンを使用して、アカウントなどのディメンション別にコントリビューションを分類します。
- Definition:メトリクスを定義するCost DefinitionおよびUsage Definitionのクエリ。
- Metadata:メトリクスの作成者、作成日時と最終更新日時、ステータス、単位などの詳細。
たとえば、結果をcloudプロバイダーなどでグループ化して、単位コストがディメンション全体でどのように分類されるかを確認できます。