Intelligent Workloads automatically unifies standalone New Relic capabilities into a single environment. Rather than requiring you to navigate across separate APM, Infrastructure, or Errors Inbox pages and apply manual filters, these integrated experiences are pre-scoped to your focal transaction and its full-stack dependencies.
Triage tools
Deep-dive into active errors and emerging performance anomalies affecting your workloads.
Errors
Access a dedicated Errors Inbox view pre-filtered to all entities within your workloads. Use this to review error groups, stack traces, and impact metrics across all participating services without leaving the workload context. For more on error tracking, see Errors inbox.
When your workload health degrades, check the Errors page first to see if error rates spiked and which services are affected.
Performance Risks (preview)
Review proactively detected anomalies and emerging risks across your workloads' dependencies. This inbox highlights subtle performance shifts before they breach standard alert thresholds or disrupt key customer journeys.
Monitoring views
Explore multi-dimensional lenses to analyze transaction flows, dependency health, and operational activity.
Transaction 360
Open an interactive distributed trace workspace scoped to your focal transaction. Use Transaction 360 to trace cross-service execution paths, review host resource consumption, and evaluate downstream service boundaries during deep troubleshooting. For more on Transaction 360, see Transaction 360 documentation.
When troubleshooting slow transactions or errors, use Transaction 360 to see exactly which service calls are slow or failing.
KPIs
Access your complete catalog of custom business metrics. While the Summary page displays up to three key KPI tiles, this dedicated page lets you view detailed time-series charts, search across all configured KPIs, and manage business-level alert thresholds.
Learn more about creating and managing KPIs →
Entity details
View a complete inventory of all services, databases, hosts, and serverless functions participating in your workloads, along with their health states and metadata. For more on entities, see Learn about entities.
When you know there's a problem but aren't sure which service is causing it, scan the Entity details page to find unhealthy entities.
Activity
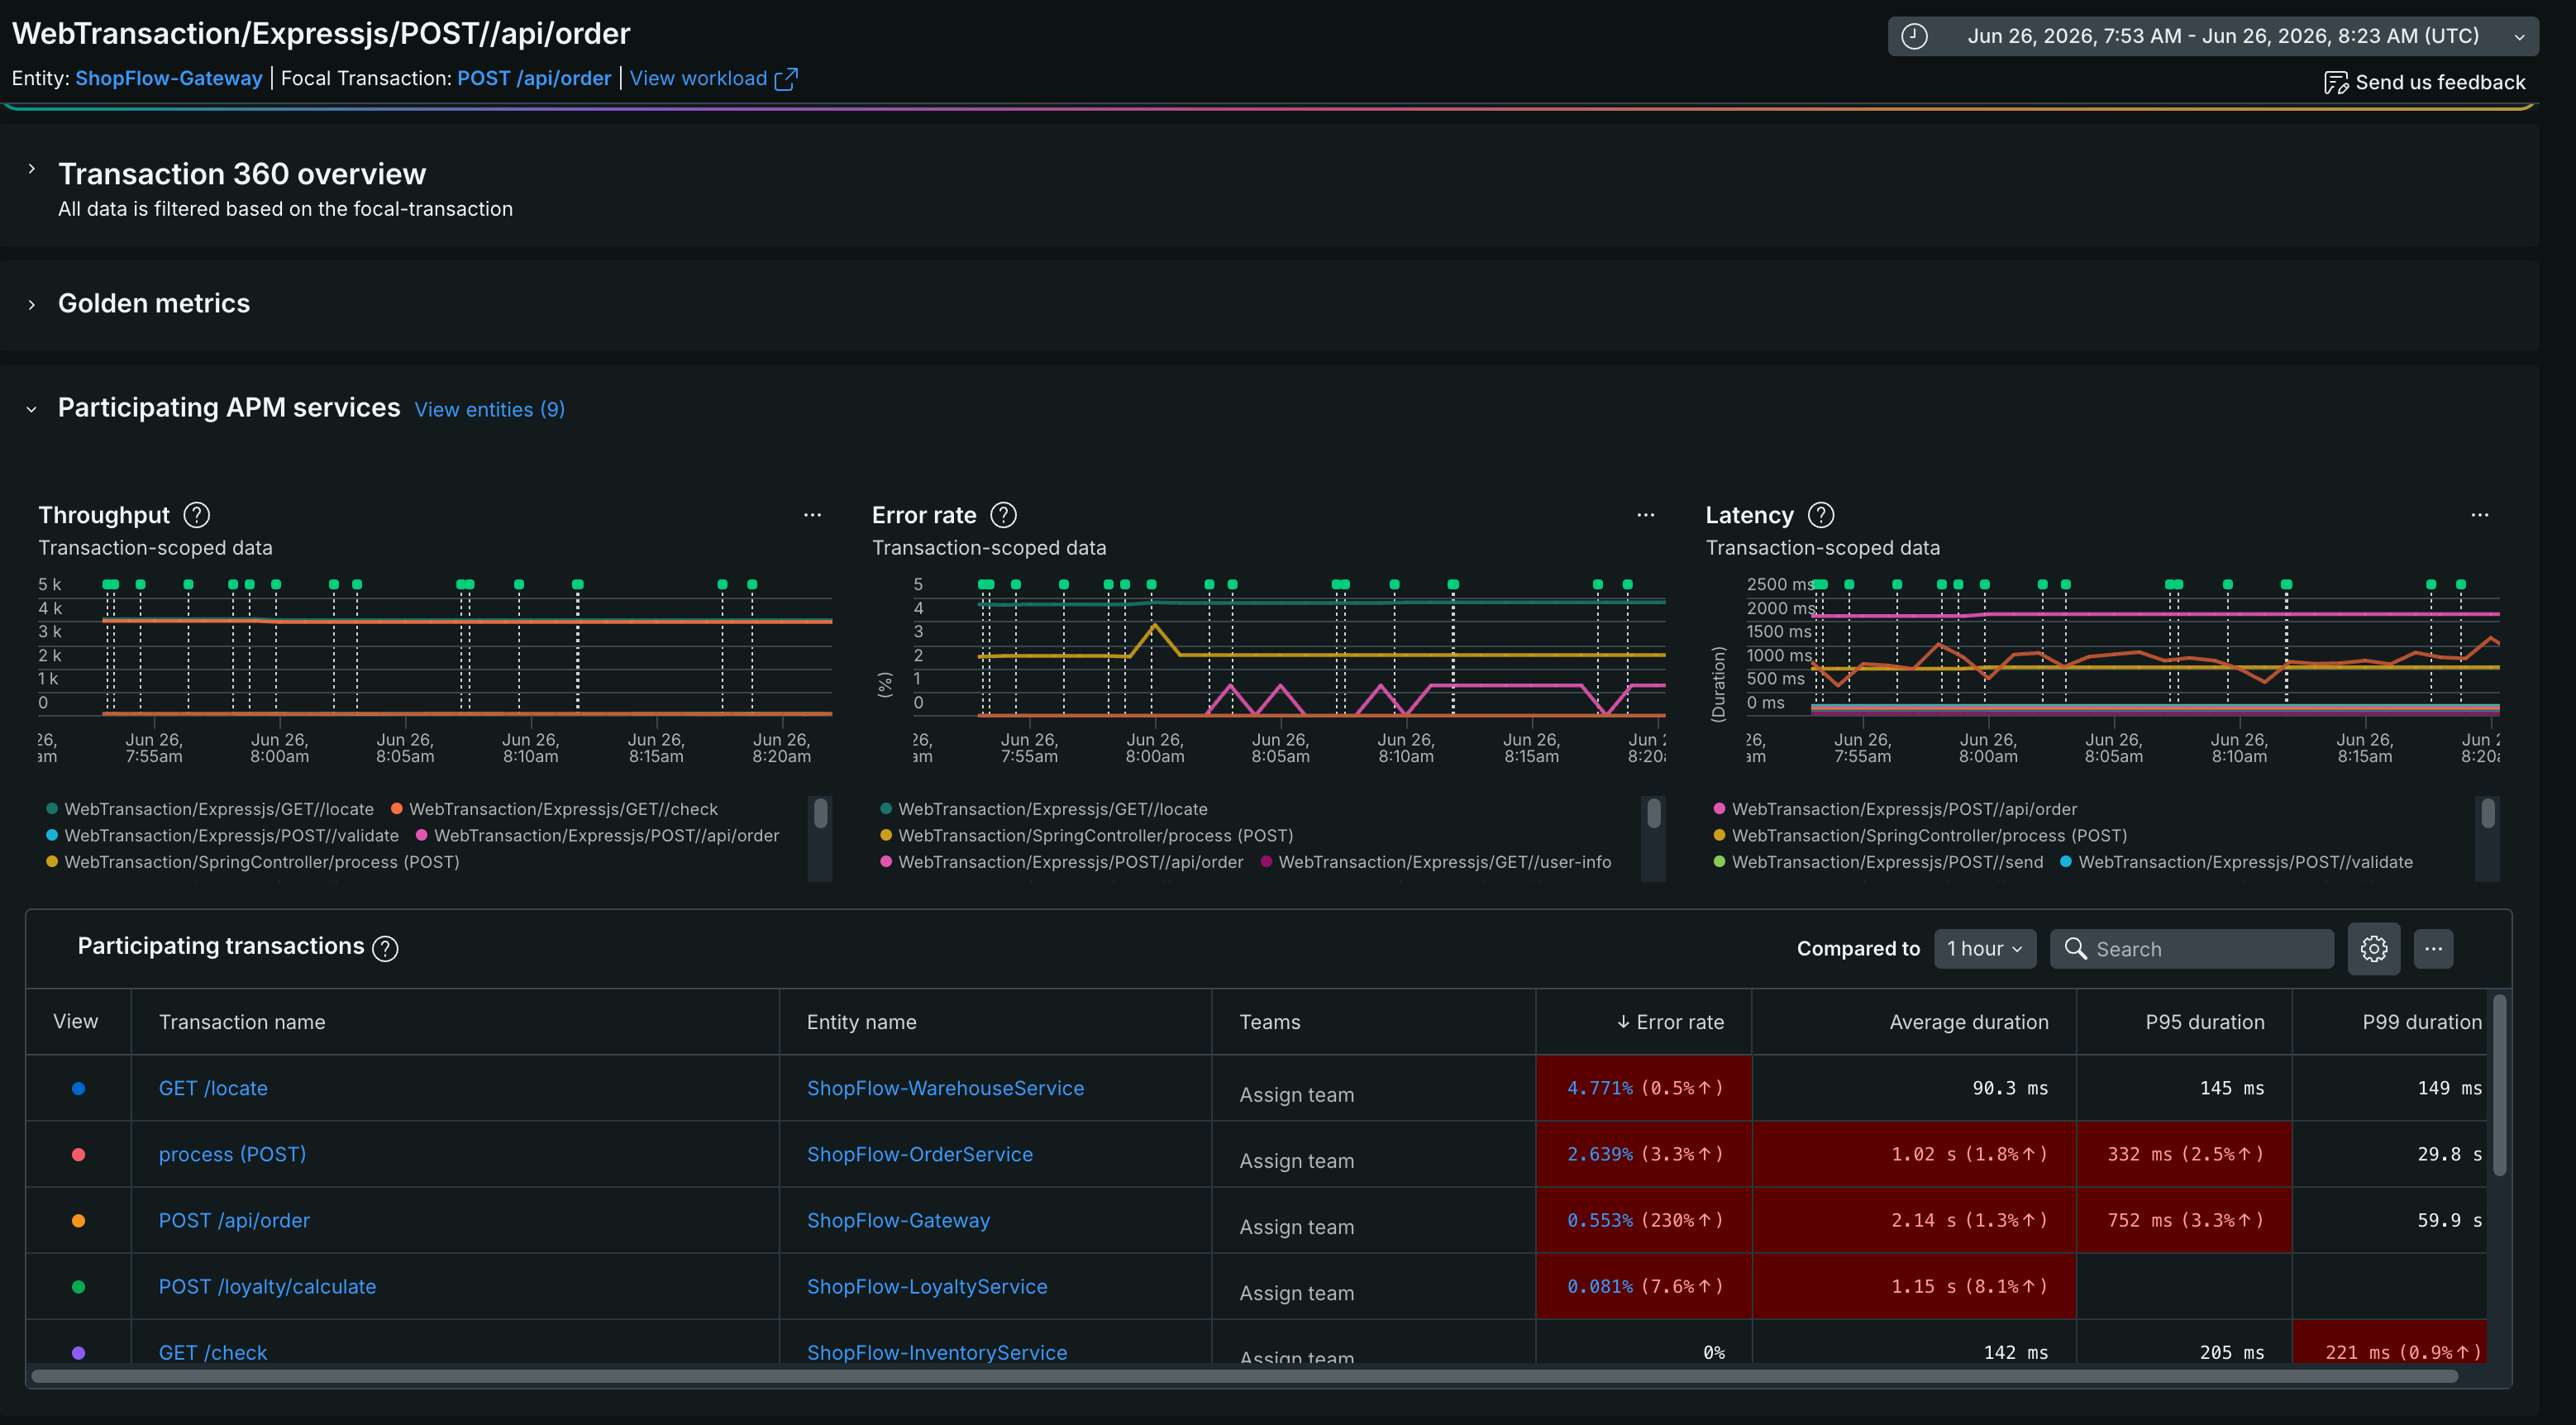
Analyze a multi-service timeline that combines performance metrics, transaction duration shifts, and infrastructure changes into one view. Use the comparative % change columns to instantly spot negative duration trends or error rate regressions across services following a deployment.
The Activity page displays:
- Throughput: Request volume across all workload services over time
- Error rate: Error percentages for each service with trend lines
- Latency: Response times showing performance variations across services
- Participating transactions: A detailed table showing transaction-level performance with comparative % change analysis
Maps
Visualize service dependencies across your workloads. If you notice missing connections or disconnected service nodes on your map, see Troubleshooting Workloads to check agent trace sampling and instrumentation requirements. For more on service maps, see Service maps documentation.
Events and tracking
Change tracking
Correlate performance shifts with environmental updates using Change tracking. This view provides a chronological log of recent deployments, feature flag toggles, and configuration updates across all workload entities. When latency increases, check Change tracking first to see if a recent code release correlates with the performance dip. For more on change tracking, see Change tracking documentation.
Reports
Service levels
Track service compliance over time using Service levels. Monitor defined Service Level Indicators (SLIs) and Service Level Objectives (SLOs) scoped to your workload dependencies to ensure key business transactions meet compliance targets. For more on service levels, see Service levels documentation.
Settings
Customize workload health calculations and metadata.
Configure health status
Define health roll-up rules for your workloads. You can aggregate individual entity alert statuses using worst-case rules, percentage thresholds, or custom NRQL conditions to determine overall workload health. For more, see Workload status configuration.
General settings
Manage workload metadata, edit names and descriptions, or delete the workload.
Importante
The focal transaction selected during workload creation cannot be modified after setup. To monitor a different transaction, create a new workload.