Once you select a trace from the trace list, you'll be directed to the trace details page in the UI. Use trace details to understand the flow of operations that make up a distributed trace, and adjust the view to find the information most important to you.
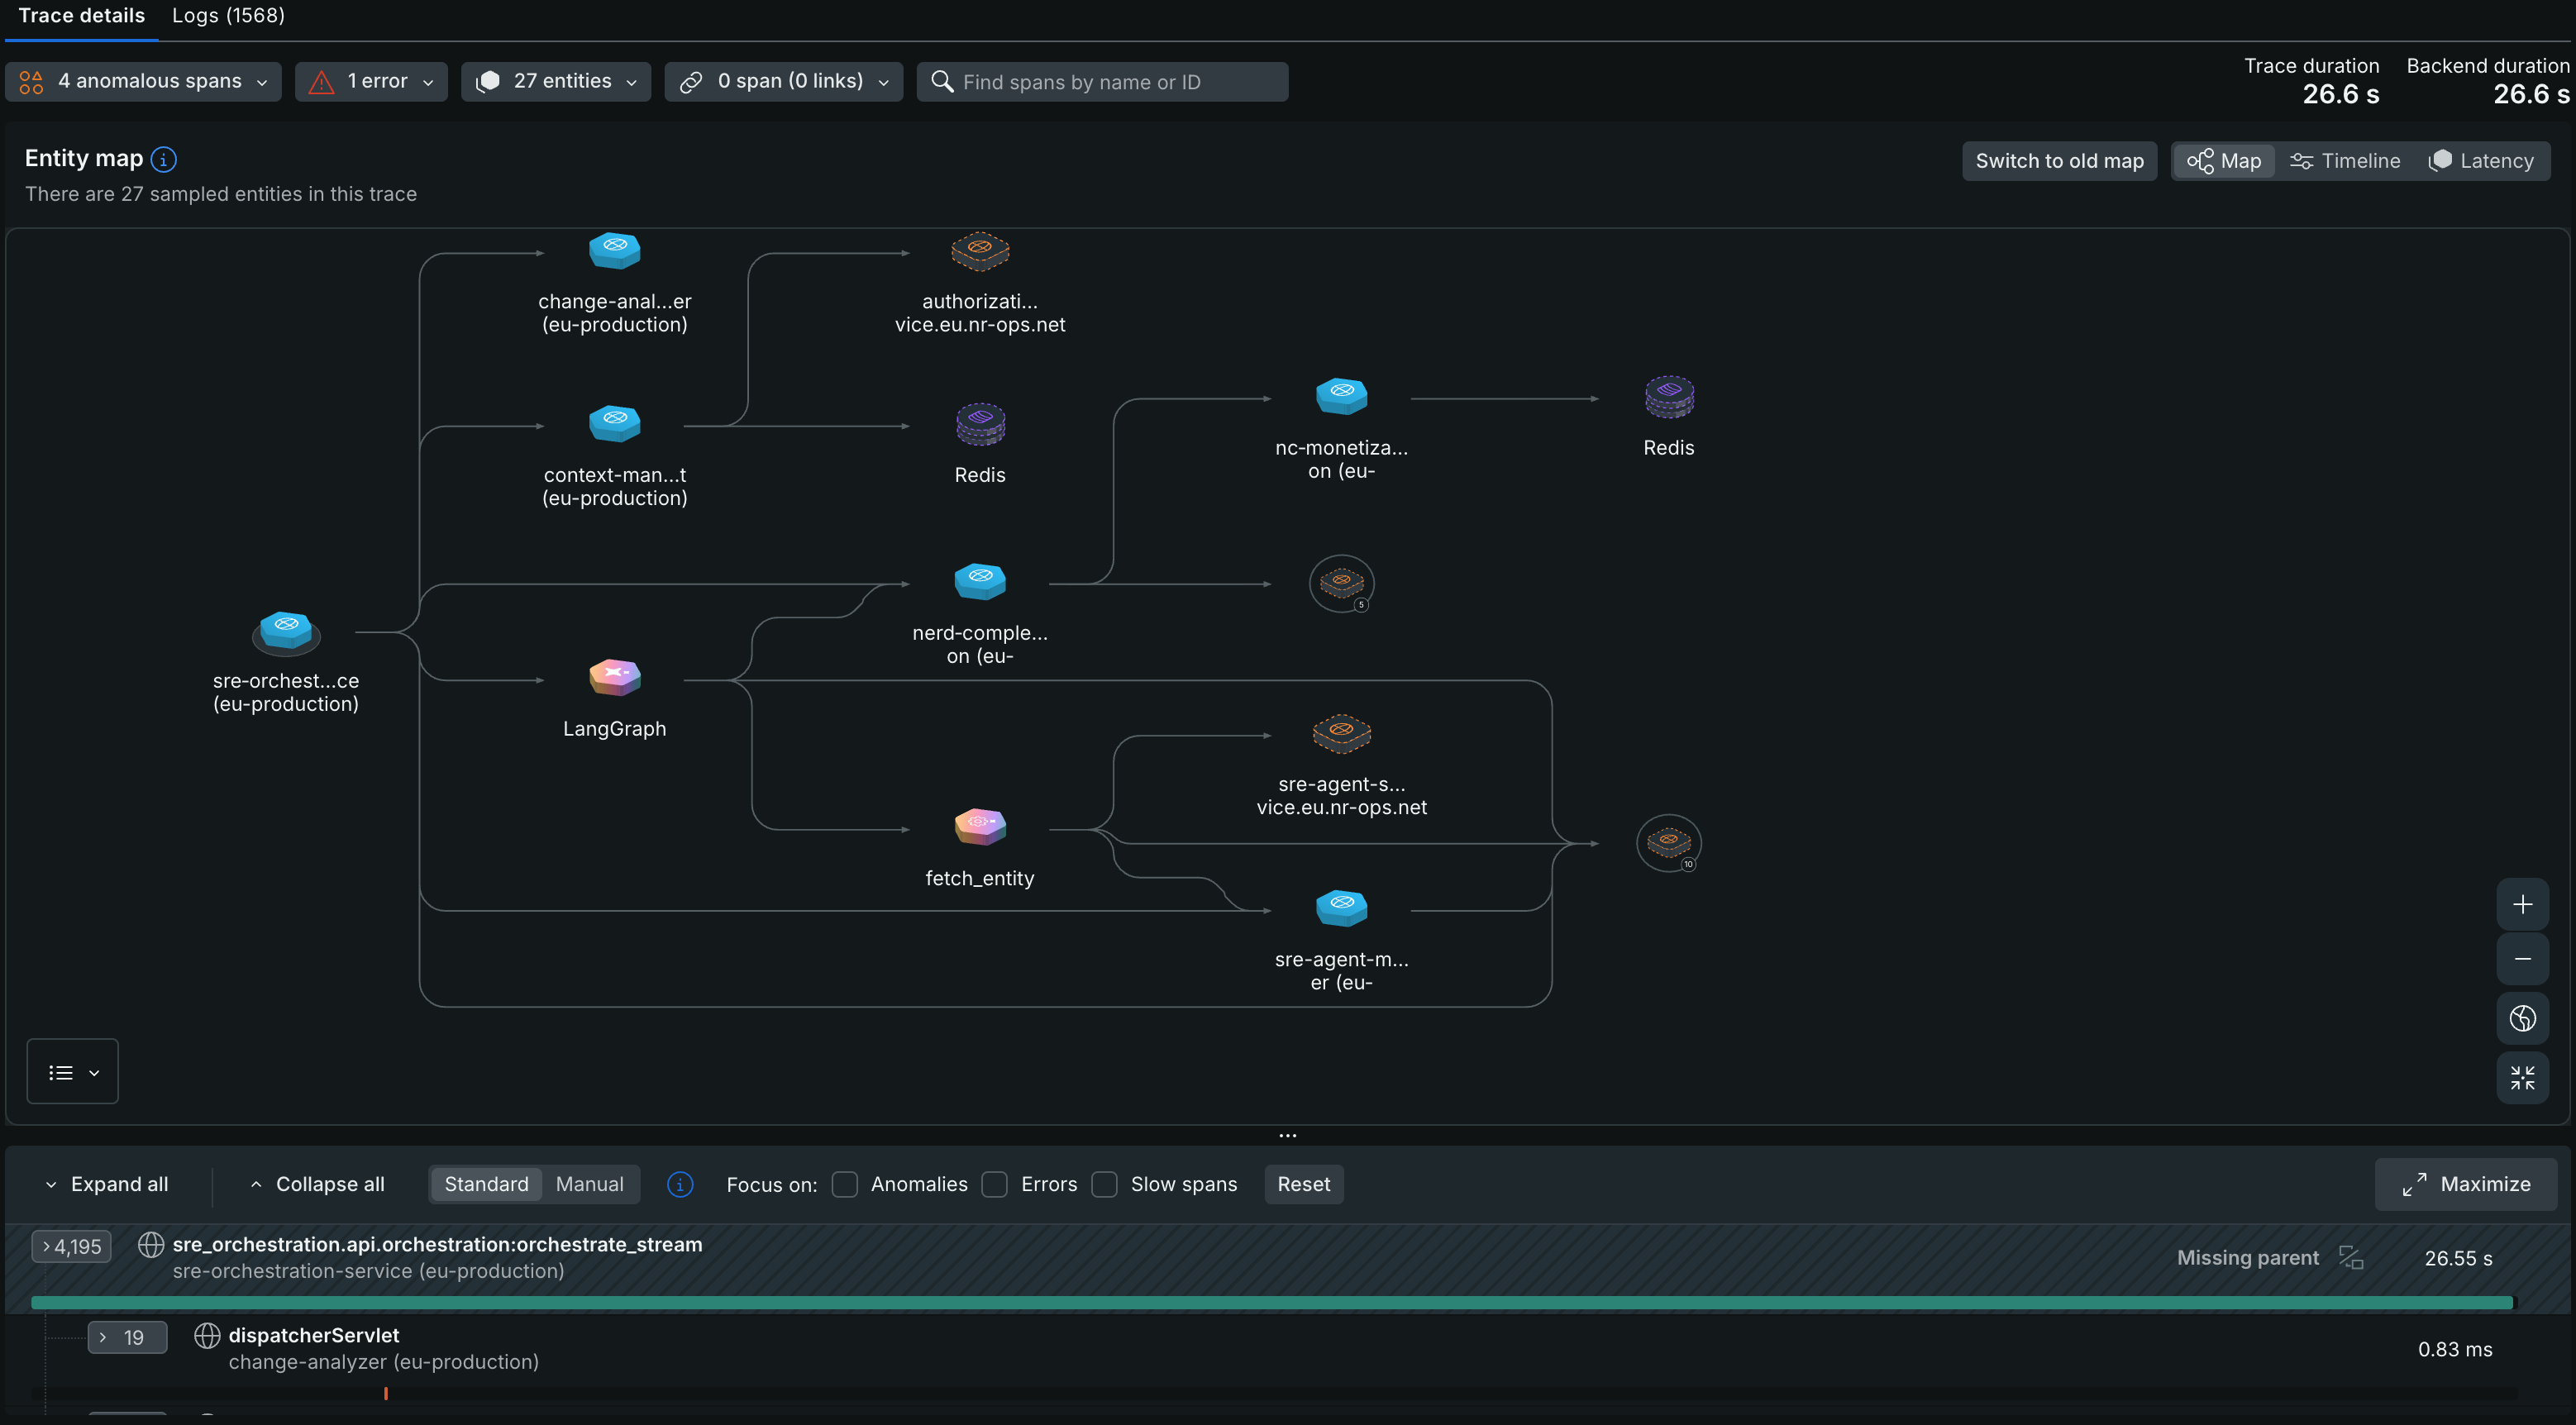
Select a trace from the list of traces to see details about it. By default, you'll see the Entity map, with a control to switch back to the previous map experience.
The trace details page offers three ways to monitor a trace: Map, Timeline, and Latency. Map is the default view when you open a trace.
The Map view, also called the Entity map, is selected by default when you open a trace. It shows all the sampled entities in the trace and how they relate to each other, using the same isometric icons and controls as Maps, which covers general map navigation, node icons, and interface controls shared across all New Relic maps.
Sugerencia
If you'd rather use the previous map experience, click Switch to old map.
A single trace can touch hundreds of entities, which can clutter the map and make it difficult to navigate. To keep the map organized, entities with low anomaly scores are automatically grouped into a cluster, while the most important entities (for example, those with errors or anomalies) stay visible outside the cluster. To view and manage entities within a cluster:
- Click the cluster node. A list of all entities in that cluster appears in the right panel.
- To display an entity separately on the map, click its visibility icon in the right panel.
In the top-right corner of the Trace details tab, change the view from Map to Timeline.
The timeline view is a high-density view of all the spans in the trace. This view allows you to quickly scroll through the entire trace and see how latency and errors propagate through the trace and across entity boundaries. You can select spans from this view to see span details in the waterfall view below it.
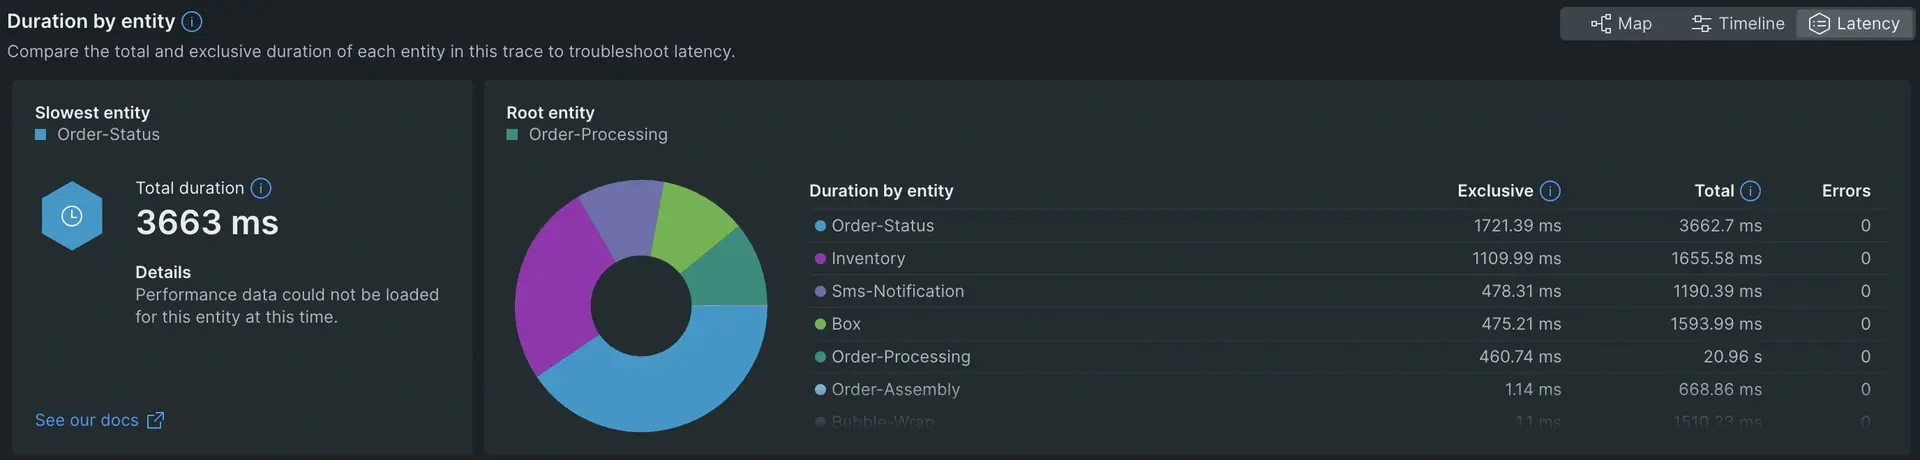
In the top-right corner of the Trace details tab, change the view from Map to Latency.
The latency view shows you how much latency is contributed by each entity in the trace, as well as the number of error spans per entity. The latency contributed by an entity is the wall-clock time that it had one or more processes running but was not making any external or database calls. Here are two examples:
If an entity has a process lasting 500ms, but 400ms of that time it's making an external call, it's shown as contributing 100ms of latency to the trace.
If an entity has three processes running in parallel for one second, and none of them made external calls, it's shown as contributing one second of latency to the trace.
Monitor operations in a trace
You can monitor all the operations that make up a distributed trace, down to the exact context from which latency and errors arise, through the waterfall view. This lets you pinpoint exactly where in the trace a problem occurred.
At the bottom of the Trace details tab, you can expand the trace to get the waterfall view. The UI indicates span properties with these icons:


Span details pane
When you select a span, a pane opens up with span details. These details can be helpful for troubleshooting performance issues. This page has three tabs:
- Performance: You'll see charts showing the average duration and throughput for that span operation, as well as how the performance of this specific span compares to the average.
- Attributes: You can learn more about attributes from our data dictionary.
- Details: You can view details, such as the span's full name and data source.
- Span links: If the span has span links, you'll see this tab. It shows causal relationships with spans from other traces. Learn more about span links.
What a span displays is based on its span type. For example, the datastore span's details will include the database query. For more on the trace structure and how span properties are determined, see Trace structure.
Understanding span links
Span links help you understand causal relationships between spans across different traces. When traces get split due to asynchronous communication or long-running processes, span links allow you to navigate between related traces and see the complete picture of your distributed system.
When traces get split
In modern distributed systems, traces can appear as separate, disconnected traces in the following scenarios:
- Long-running workflows: Background jobs or workflows that exceed trace duration limits (90+ sec for head-based sampling, 20+ sec for Infinite Tracing) or run for extended periods.
When tracing across message queues, it's generally recommended to use span links to associate traces from the producer(s) and consumer(s). Examples include:
- General asynchronous message queues: A service publishes messages to a queue (like AWS SQS, RabbitMQ, or Kafka), and another service consumes them later
- Batch-processing: Workers that process multiple messages in batches, where each message originated from a different trace
- Fan-in pattern: Multiple services independently produce messages that one consumer aggregates
- Fan-out pattern: Multiple consumers consume from one message queue - each starting its own trace
When traces are split like this, traditional parent-child relationships don't capture the full picture. Span links fill this gap by creating explicit causal connections.
What are span links?
Span links are OpenTelemetry attributes that create causal relationships between spans that don't have a direct parent-child connection. They allow you to:
- Navigate from a consuming span back to the producing span
- Understand the complete request flow even when traces are split
- Debug issues that span across asynchronous boundaries
A span link includes the trace ID and span ID of the related span, allowing New Relic to connect the traces for you.
Identifying traces with span links
In the trace details UI, traces with span links are marked in several ways:
- Span links filter badge: In the trace filter bar, you'll see a badge showing the number of spans with links (for example,
span links (2)). - Span count indicator: When viewing the list of spans, each span shows a link count if it has span links.
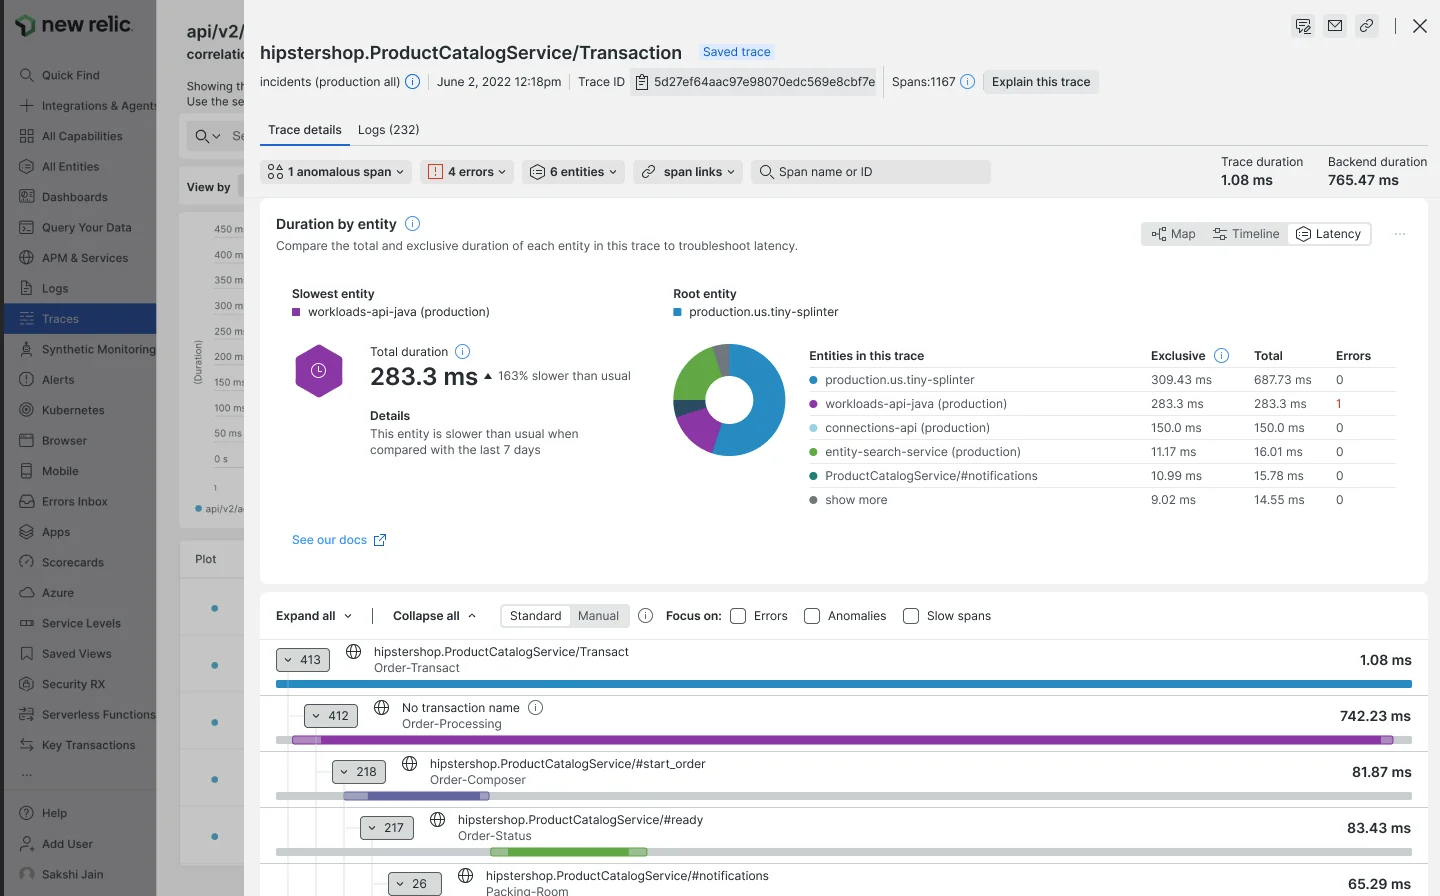
The span links filter badge appears in the trace filter bar when a trace contains spans with links.
Viewing span links
To view and navigate span links:
From the trace details page, select a span from the span links dropdown.
In the span details pane, click the Span links tab.
You'll see a list of linked traces with the following information:
- Direction badge:
Forwardindicates a span that occurred later in time (successor), whileBackwardindicates a span that occurred earlier (predecessor). - Trace ID: The ID of the linked trace (truncated for display).
- Timestamp: When the linked span occurred.
- Duration: How long the linked span took.
- Errors: Number of errors in the linked trace.
- Direction badge:
Click on a linked trace to navigate to it. Use your browser's back button to return to the original trace.
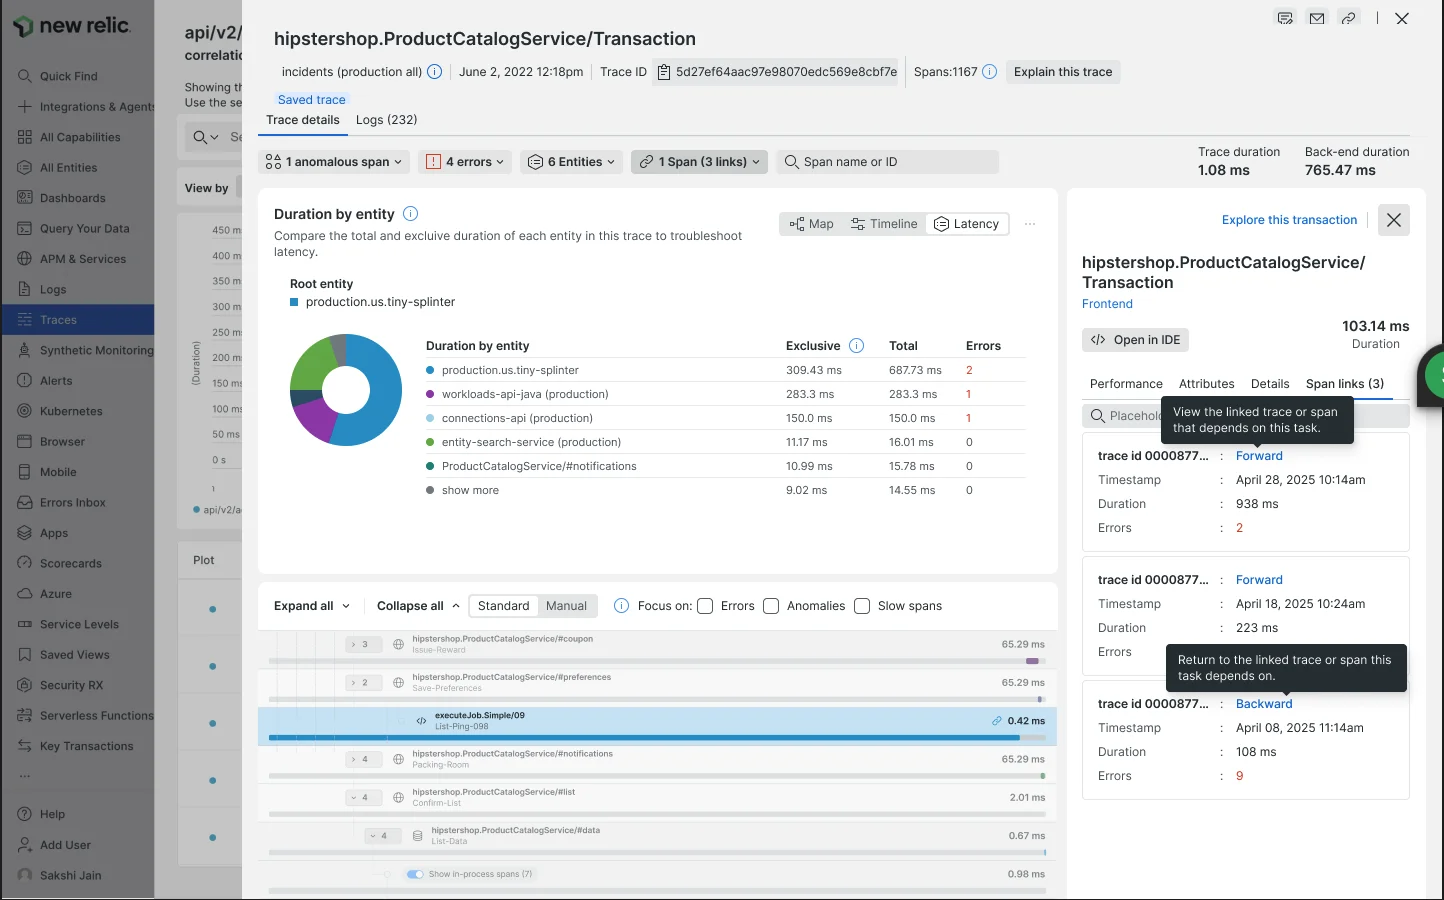
The Span links tab displays linked traces with direction badges (Forward/Backward), trace IDs, timestamps, durations, and error counts.
Sugerencia
Understanding forward vs. backward links
- Forward links: Point to traces that happened as a result of the current span. Example: A message was published by this span and processed later by another trace.
- Backward links: Point to traces that caused the current span. Example: This span is processing a message that was published by an earlier trace.
When span links don't appear
If you expect to see span links but they're not appearing, check the following:
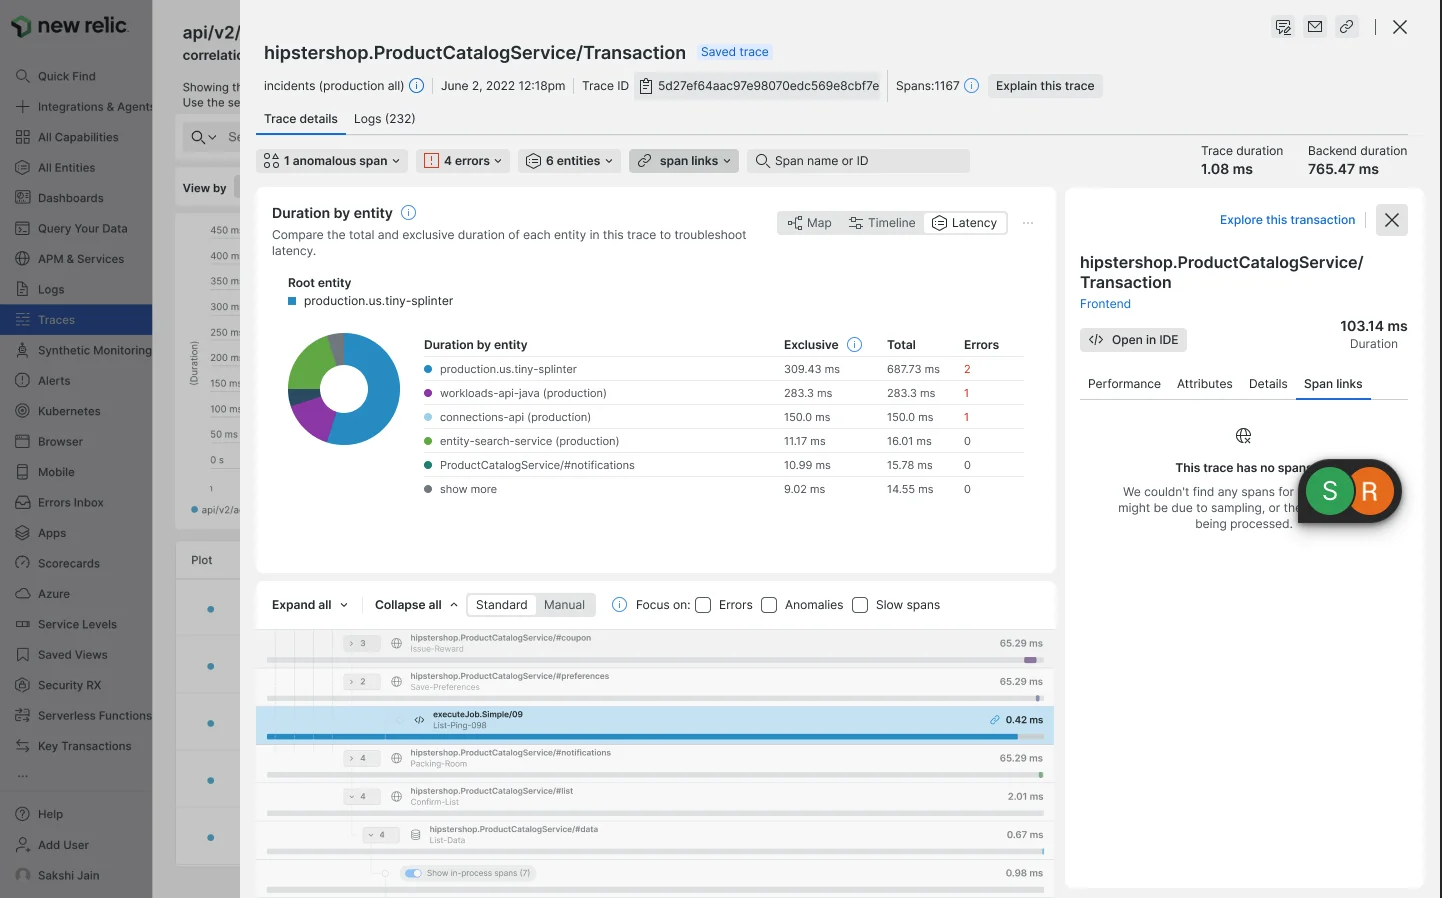
When a trace has no span links, you'll see this message in the Span links tab.
For more information on implementing span links in your instrumentation, see our OpenTelemetry best practices guide for traces.
Span attributes
If you'd like to learn more about Span data:
- Explore your span data using the query builder.
- To see the default attributes attached to span data, use the data dictionary.
- Check out these example queries for help with NRQL queries using these attributes.
View related logs
If you are using our logs in context feature, you can see any logs that are linked to your traces:
- Go to the trace details page by clicking on a trace.
- In the upper-left corner of the span details page, click the Logs tab.
- For details related to an individual log message, click directly on the message.