Transaction 360 automatically captures and correlates all entities and data related to a specific transaction, providing a comprehensive view of your distributed workload. This holistic approach includes transaction flows, service relationships, and performance metrics across your entire stack, enabling you to quickly identify and resolve issues.
What Transaction 360 shows you
Transaction 360 provides three main views to help you understand your workload:
- Overview dashboard: High-level summary with entity counts, issues, and change tracking
- Dynamic flow map: Visual representation of transaction paths and service dependencies
- Entity breakdown: Detailed performance metrics for all participating components
Access Transaction 360
- Go to one.newrelic.com > APM and Services
- Select your service from the APM summary page
- Go to Transactions > Transaction Details > View transaction 360 workload
Importante
Database and Serverless monitoring sections are currently available in staging environments. Ensure you have appropriate account permissions and proper instrumentation to access these features.
Dynamic flow map

The Dynamic Flow map is a component within Transaction 360 that visualizes the transaction flow using aggregated trace data. It displays the services involved in the selected transaction and the time taken by each service, using color-coded anomaly indicators to highlight where latency or errors that are correlated with the focal transaction's performance are occurring.
When you click on any service in the map, you can:
- View tracing metrics between the focal transaction and the selected service.
- Review time series charts showing performance trends for both services.
- Assign teams to entities to facilitate collaboration and issue resolution.
- Add tags to entities to streamline the investigation process.
The dynamic flow map uses anomaly detection to help you identify which services are directly impacted by performance issues correlated with the focal transaction, enabling you to focus your investigation on the root cause.
Host analysis:
- Resource ranking: Identify hosts with highest resource consumption.
- Related services: See which applications run on each host.
Collaboration features:
- Team assignment: Assign teams to transaction workloads for faster alert event response.
- Tagging: Group related entities to streamline investigation and organization.
For more details about Dynamic Flow Map features and capabilities, see Dynamic Flow Map.
Entity performance breakdown
This section provides detailed metrics for each type of component in your transaction workload:
APM services
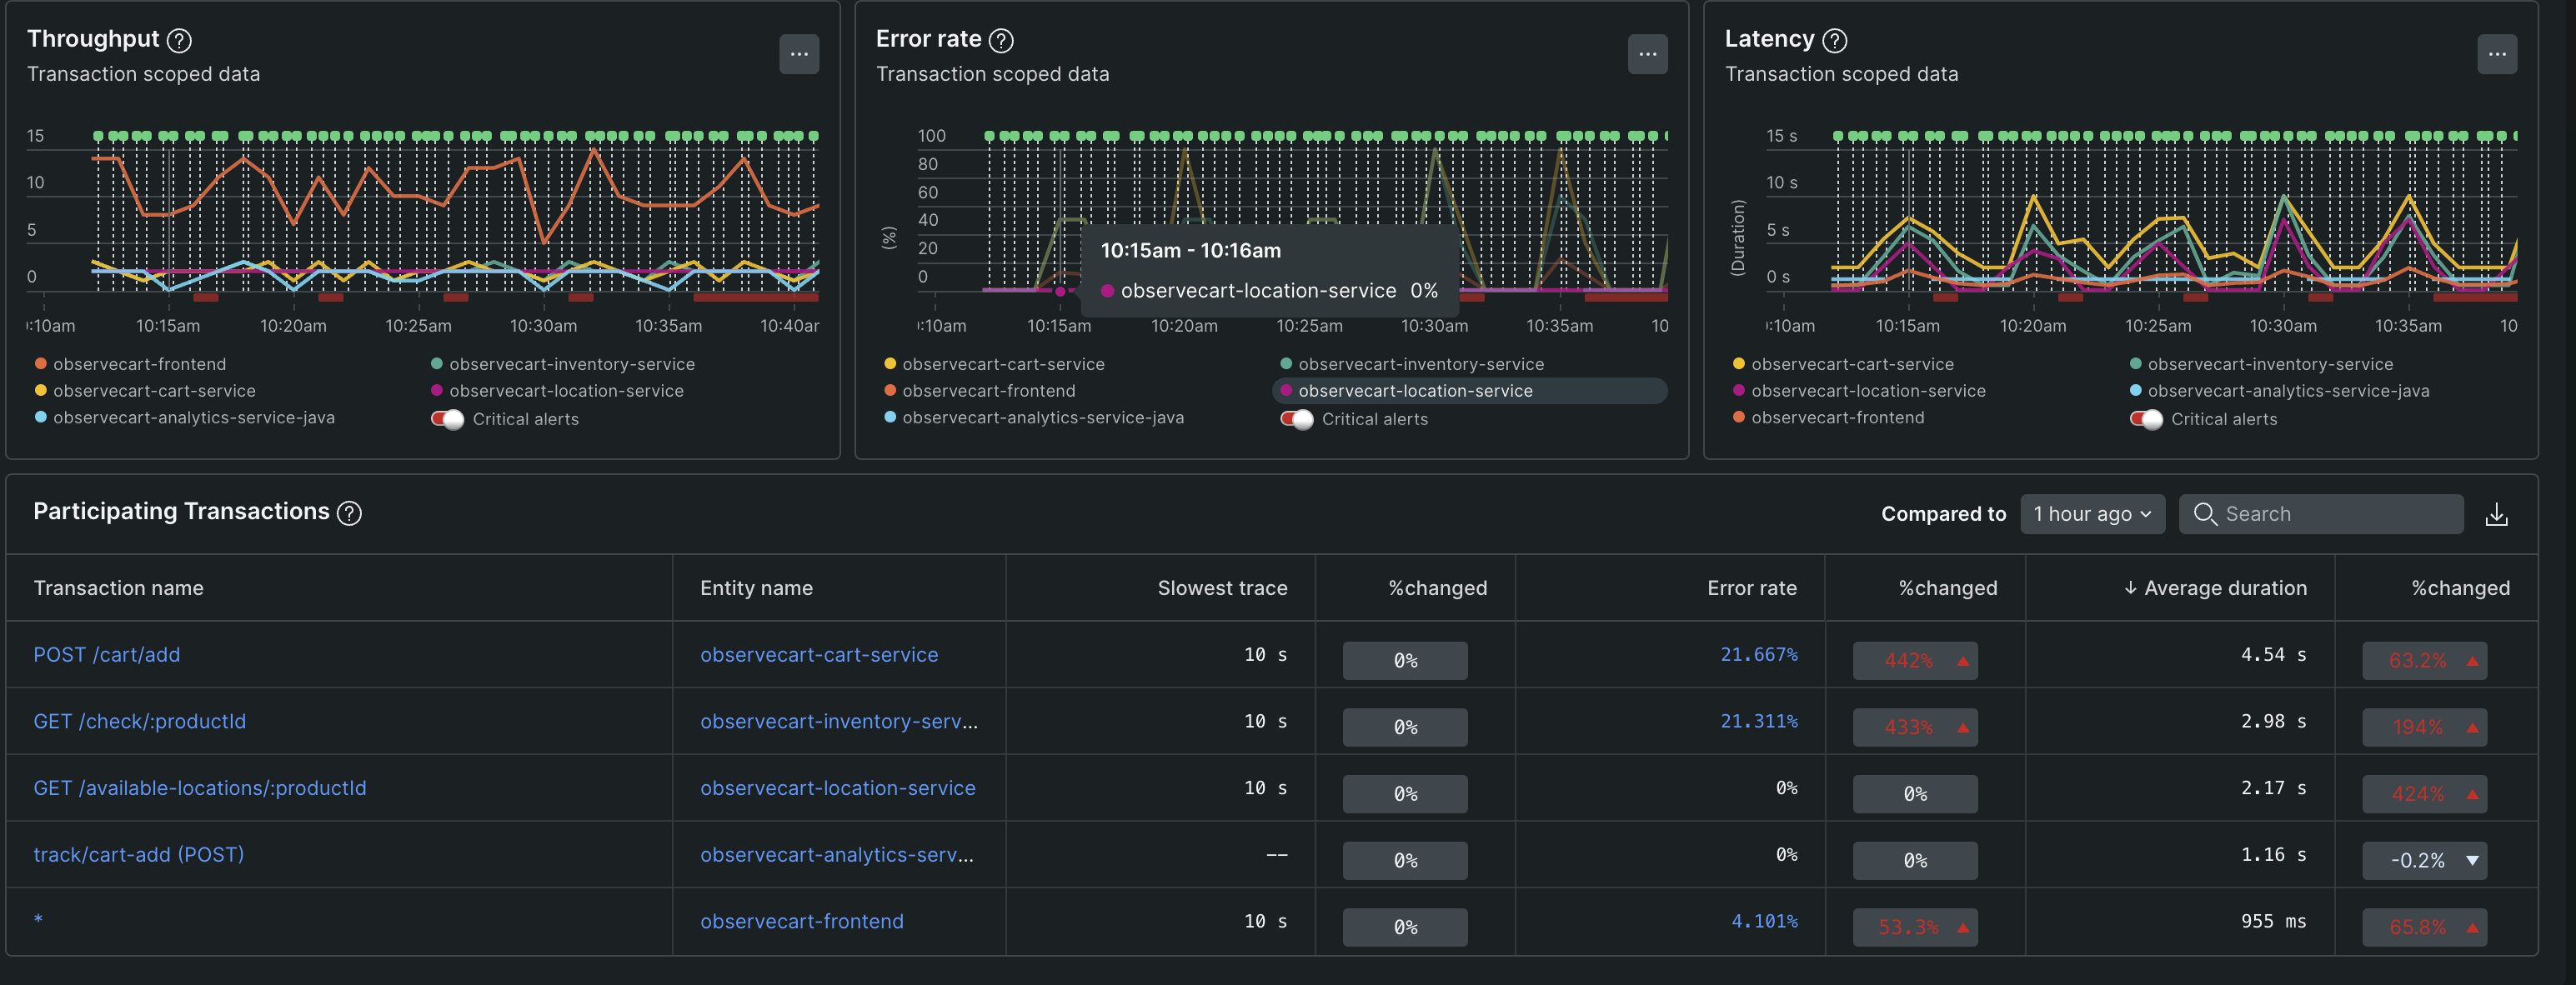
Monitor your application services with:
Service metrics table:
- Throughput: Requests per minute for each service
- Error rate: Percentage of failed requests
- Response time: Average latency per service
- Issue severity: Critical, warning, and info alerts to prioritize fixes
Transaction analysis:
- Performance changes: Transactions with the highest response time changes
- Trace details: Click any transaction to view its complete trace flow
- Change tracking: The number of change tracking markers detected in the transaction workload, indicating changes in the workload's performance. Click View details to view the change tracking markers and identify the entities that are directly impacted by the performance changes.
Browser applications
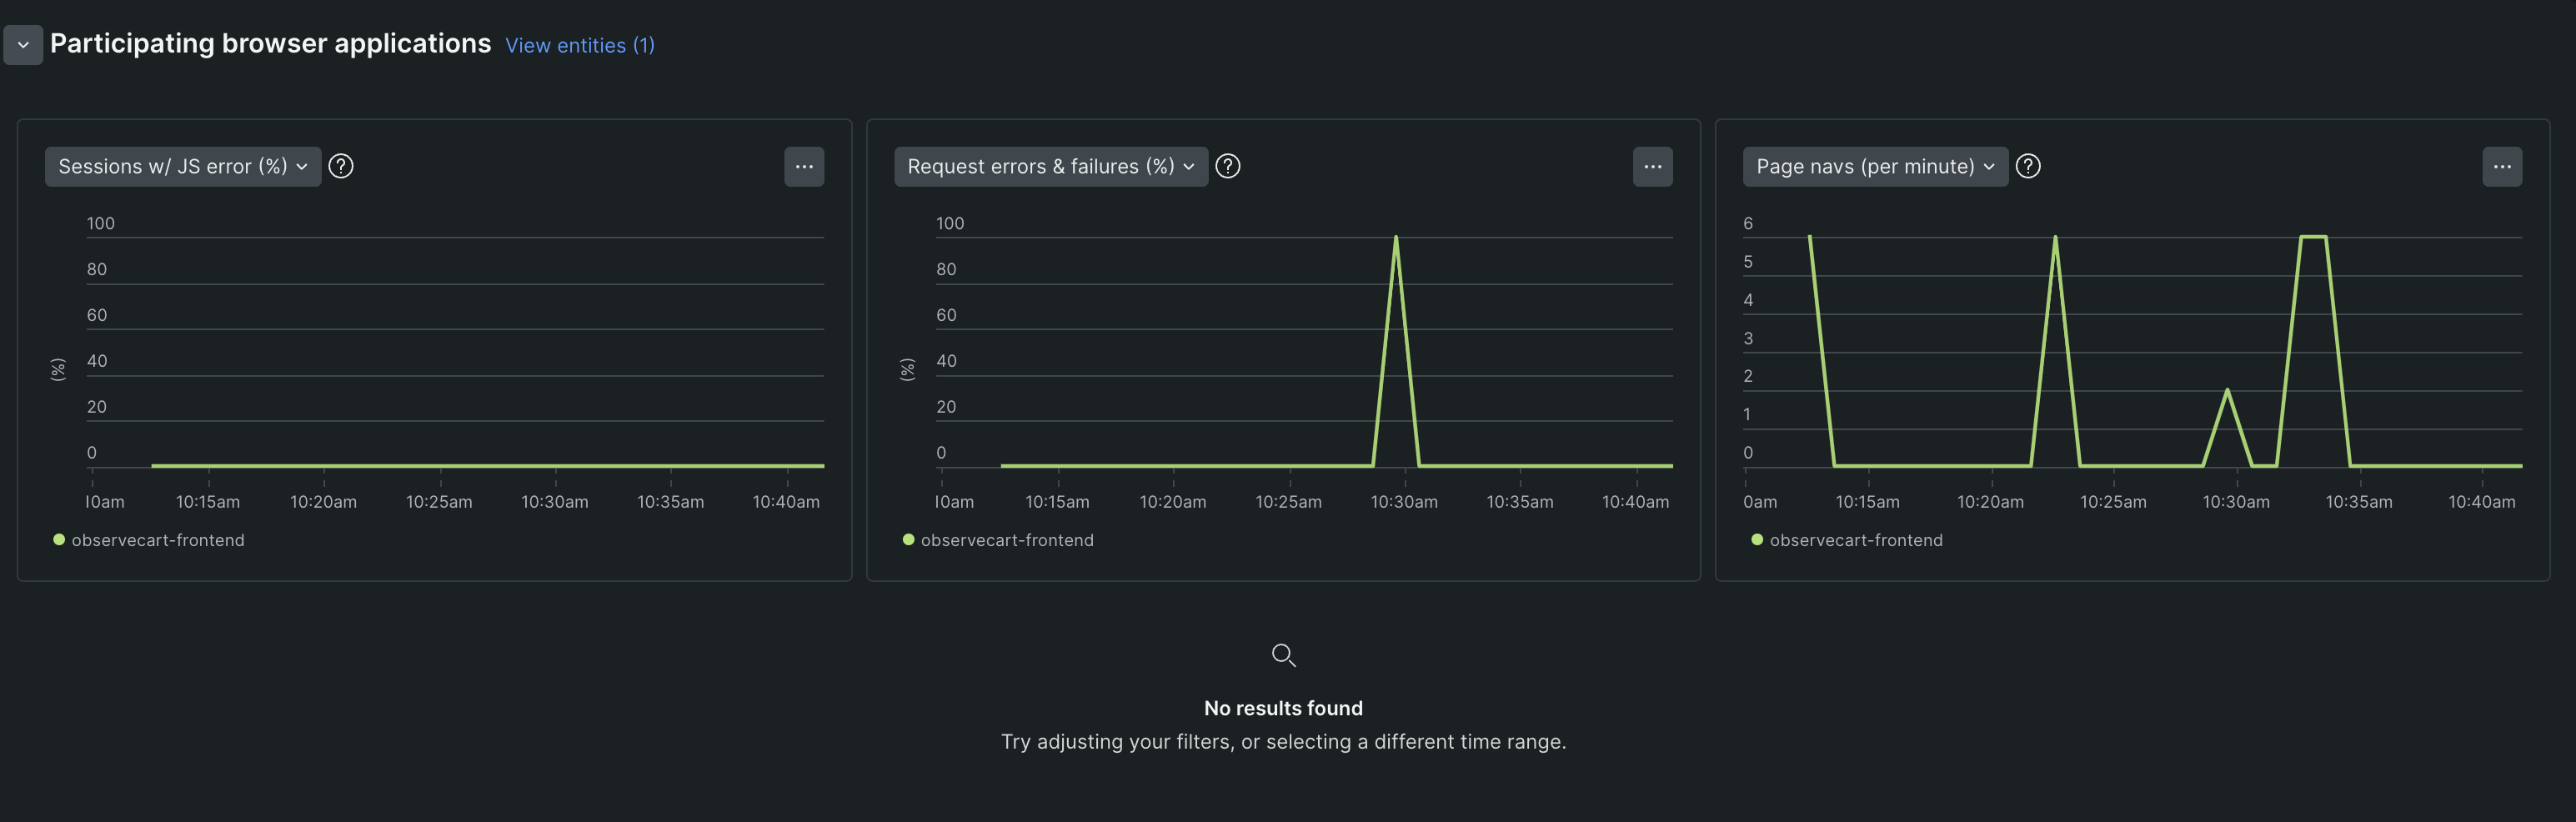
Monitor frontend performance and user experience:
Performance metrics:
- Page load times: Frontend rendering and loading performance
- JavaScript errors: Client-side errors affecting user experience
- Page views: Traffic patterns and user engagement
User experience tools:
- Session replay: Watch user sessions to understand performance impact on real users
- Click sessions to view detailed user interaction data
- For more details, see Session Replay documentation
Database monitoring
Track database performance with comprehensive metrics:
Performance visualization:
- Throughput chart: Database operations per minute over time
- Query time chart: Response time trends and performance patterns
Query analysis table:
- Database operations: Call counts, duration, and timing metrics per query
- Performance ranking: Max, mean, and total execution times
- Query optimization: Identify slowest and most frequent queries
Transaction impact table:
- Database dependency: Shows which transactions rely most heavily on database operations
- Time allocation: Percentage of transaction time spent on database calls
- Optimization targets: Transactions with highest database overhead
Interactive drill-down:
- Click query counts to see all queries used by a specific transaction
- Click transaction names to filter queries by that transaction
- Access stack traces through individual query details
Serverless functions
Monitor AWS Lambda and other serverless components:
Customizable performance charts:
- Invocation patterns: Function execution frequency over time
- Duration metrics: Execution times and performance trends
- Memory utilization: Resource consumption patterns
- Cost tracking: Associated expenses for function invocations
Function analysis:
- Transaction relationships: See which transactions trigger serverless functions
- Performance impact: How function performance affects overall transaction speed
- Resource efficiency: Memory allocation vs. actual usage
Mobile applications
Track mobile app performance within your transaction flow:
- App performance: Response times and user experience metrics
- Crash rates: Mobile-specific error tracking
- Device metrics: Performance across different mobile devices
AI/LLM monitoring
Monitor Large Language Model performance and costs:
- Model performance: Response times and accuracy metrics for AI services
- Cost tracking: Token usage and associated costs
- Error rates: Failed AI requests and timeout issues
For detailed AI monitoring setup, see AI monitoring documentation.
Next steps
After identifying issues in Transaction 360:
- Prioritize fixes: Start with critical alerts and highest-impact performance problems
- Instrument gaps: Add monitoring to uninstrumented entities for complete visibility
- Set up proactive monitoring: Create alerts for key transaction performance thresholds
- Collaborate: Use team assignments and tags to coordinate resolution efforts
Transaction 360 provides the comprehensive view you need to quickly understand, diagnose, and resolve issues across your entire distributed workload.